গতিশীল আদর্শিক প্রবণতা বিপরীত কৌশল

ওভারভিউ
ডায়নামিক আইডিওলজিকাল ট্রেন্ড রিভার্সন কৌশলটি প্রবণতা রিভার্সের জন্য মূল্যের পূর্বাভাস দেওয়ার জন্য এবং মুভিং এভারেজ গঠনের সাথে যুক্ত আইডিওলজিকাল ট্রেডিং সিগন্যাল তৈরির জন্য ব্যবহার করে। যখন পূর্বাভাস মূল্য নীচে থেকে উপরে চলে যায় তখন একটি কেনার সংকেত উত্পন্ন হয়; যখন পূর্বাভাস মূল্য নীচে থেকে নীচে চলে যায় তখন একটি বিক্রয় সংকেত উত্পন্ন হয়, যা প্রবণতা বিপরীতকরণকে ক্যাপচার করে।
কৌশল নীতি
- লেনদেনের ভলিউমের উপর ভিত্তি করে শেয়ারের দামের লিনিয়ার রিগ্রেশন, দামের পূর্বাভাস
- চলমান গড় গণনা করুন
- যখন পূর্বাভাস মূল্য নীচে থেকে উপরে একটি চলমান গড় অতিক্রম করে, একটি ক্রয় সংকেত উত্পন্ন হয়
- যখন প্রাক্কলিত দামগুলি চলমান গড়ের উপরে থেকে নীচে চলে যায়, তখন একটি বিক্রয় সংকেত তৈরি হয়
- MACD সূচকগুলির সাথে মিলিত হয়ে ট্রেন্ডের বিপরীত হওয়ার সময় নির্ধারণ করুন
উপরের সংকেতগুলি একাধিক নিশ্চিতকরণের সাথে মিলিত হয়, যা মিথ্যা ভাঙ্গন এড়াতে এবং সংকেতের নির্ভুলতা বাড়ায়।
সামর্থ্য বিশ্লেষণ
- লাইন রিগ্রেশন ব্যবহার করে মূল্য প্রবণতা পূর্বাভাস, সংকেত নির্ভুলতা উন্নত
- চলমান গড়ের সাথে যুক্ত হয়ে একটি মতাদর্শ তৈরি করা, প্রবণতা বিপরীতকরণ ধরা
- লেনদেনের পরিমাণের উপর ভিত্তি করে লিনিয়ার রিগ্রেশন আরও বেশি অর্থবহ
- একাধিক নিশ্চিতকরণের জন্য MACD এর মতো সূচকগুলির সাথে মিলিত, যা মিথ্যা সংকেত হ্রাস করে
ঝুঁকি বিশ্লেষণ
- লিনিয়ার রিগ্রেশন এর পরামিতি সেটিং এর ফলাফলের উপর অনেক প্রভাব রয়েছে
- চলমান গড়ের সেটিংগুলিও সংকেতের গুণমানকে প্রভাবিত করে
- কনফার্মেশন ব্যবস্থা থাকা সত্ত্বেও, ভুয়া সংকেতের ঝুঁকি রয়েছে
- কোডটি আরও অপ্টিমাইজ করা যেতে পারে যাতে লেনদেনের সংখ্যা হ্রাস পায় এবং মুনাফা বৃদ্ধি পায়
অপ্টিমাইজেশান দিক
- অপ্টিমাইজেশান লিনিয়ার রিগ্রেশন এবং মুভিং এভারেজের প্যারামিটার
- কনফার্মেশন কন্ডিশন যুক্ত করুন এবং মিথ্যা সংকেত হ্রাস করুন
- আরও কিছু বিষয়ের সাথে মিলিত হয়ে প্রবণতা পাল্টাচ্ছে
- একক লেনদেনের ঝুঁকি হ্রাস করার জন্য স্টপ লস কৌশল অপ্টিমাইজ করুন
সারসংক্ষেপ
ডায়নামিক আইডিওলজি ট্রেন্ড রিভার্সন কৌশলটি লিনিয়ার রিগ্রেশন পূর্বাভাস এবং চলমান গড় গঠনের সাথে সংযুক্ত একটি আইডিওলজি যা ট্রেন্ড রিভার্সের সময়কালকে ক্যাপচার করে। একক সূচকের তুলনায় এটির উচ্চতর নির্ভরযোগ্যতা রয়েছে। একই সাথে, কৌশলটি প্যারামিটার সমন্বয় এবং নিশ্চিতকরণ শর্তগুলির অপ্টিমাইজেশনের মাধ্যমে সংকেতের গুণমান এবং মুনাফা স্তরকে আরও উন্নত করতে পারে।
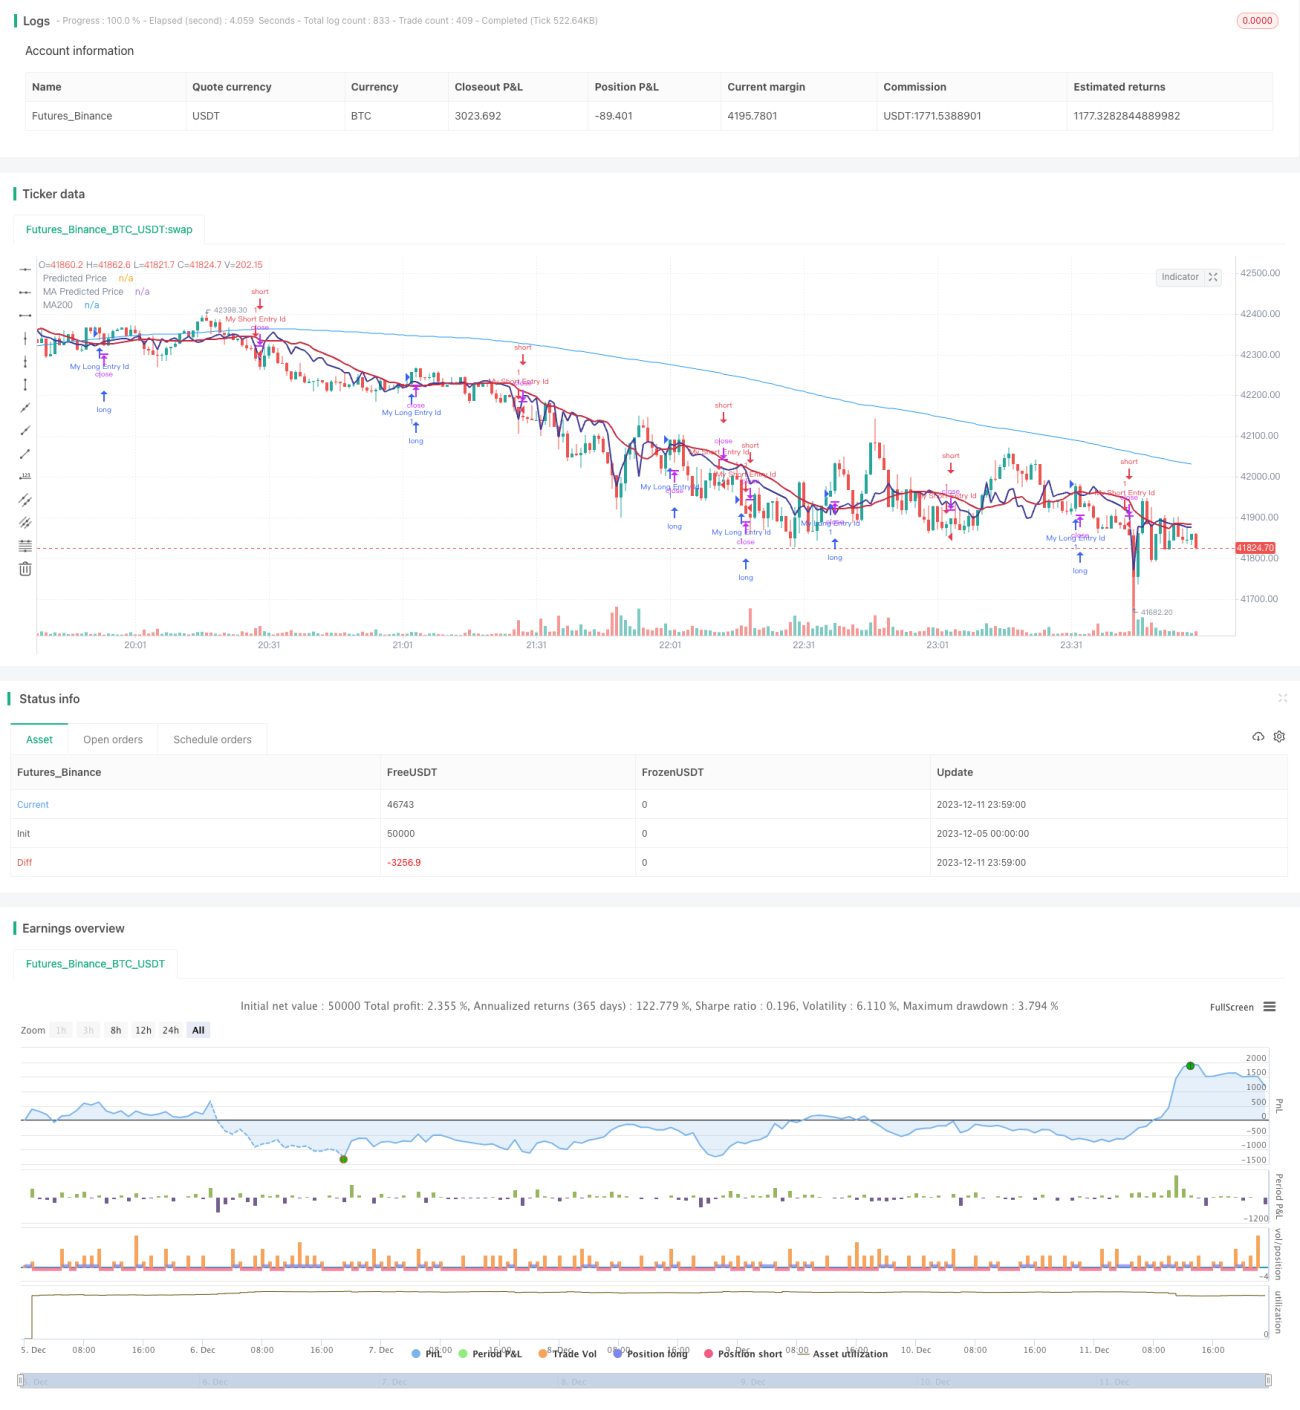
/*backtest
start: 2023-12-05 00:00:00
end: 2023-12-12 00:00:00
period: 1m
basePeriod: 1m
exchanges: [{"eid":"Futures_Binance","currency":"BTC_USDT"}]
*/

// This source code is subject to the terms of the Mozilla Public License 2.0 at https://mozilla.org/MPL/2.0/
// © stocktechbot
//@version=5
strategy("Linear Cross", overlay=true, margin_long=100, margin_short=0)- 1