Duale quantitative CCI-Strategie

Überblick
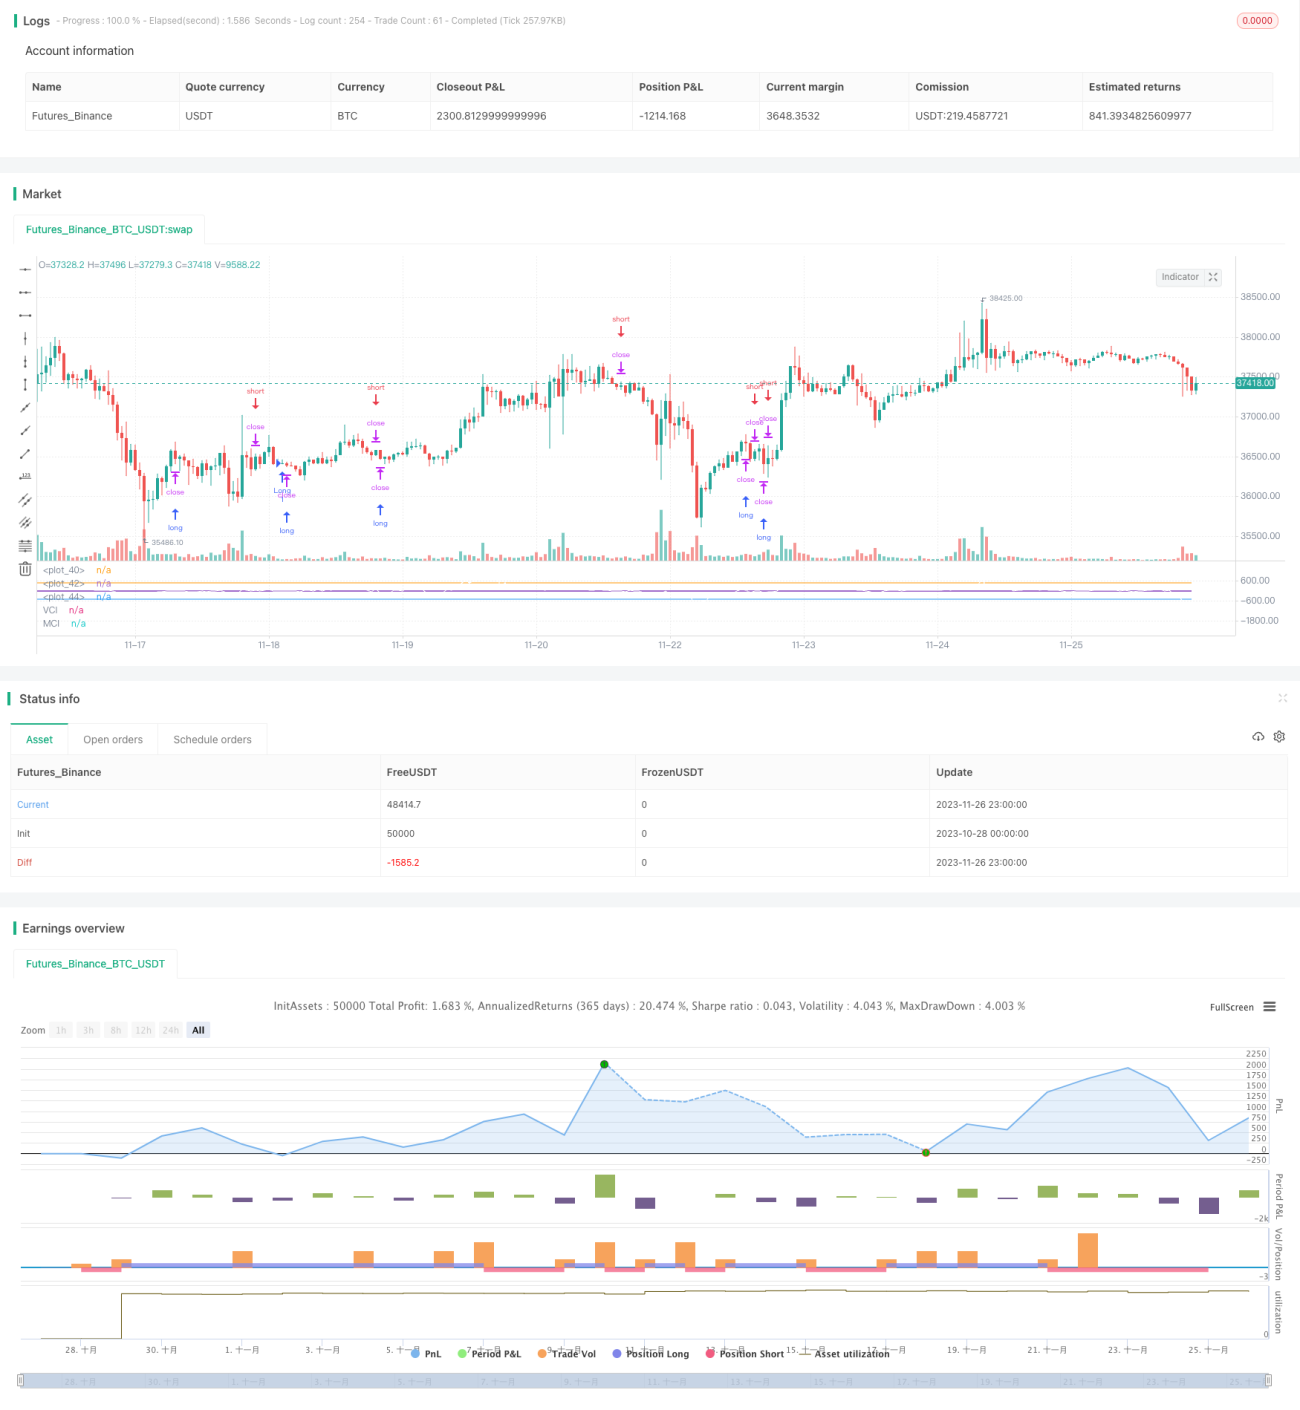
Die Strategie, die ein Handelssignal durch die Kombination der klassischen technischen Indikatoren CCI und der eigenständig entwickelten VCI, MCI-Doppelindex erzeugt, gehört zu den typischen quantitativen Handelsstrategien. Sie erzeugt Handelssignale durch die Identifizierung von Trends in der Veränderung von Volumen und Preis und die Beurteilung der wichtigsten Handelsrichtung und -intensität des aktuellen Marktes. Sie kann in zahlreichen Finanzinstrumenten wie Digitalwährungen, Devisen und Aktien angewendet werden.
Strategieprinzip
- Berechnen Sie die OHLC4-Mittellinie und bestimmen Sie die Preise in Verbindung mit dem CICI-Index.
- Die Berechnung des OBV-Wertes zur Messung des Kapitalflusses;
- Berechnung des VCI-Index, der die Verteilung der Kapitalströme anhand der Differenz der OBV-Indikatoren misst;
- Berechnung des MCI-Index, der die Preisverteilung anhand der Preisdifferenz misst;
- Der VCI wird mit dem MCI-Index verglichen, um die Kauf- und Verkaufssituation des Marktes zu beurteilen.
- VCI > MCI, der Käufer ist bereit;
- VCI < MCI, der Verkäufer ist bereit;
- Mehrfaches Shorting-Signal basierend auf dem Vergleich von VCI und MCI;
Analyse der Stärken
- Die Strategie berücksichtigt Preise, Transaktionsvolumen und Kapitalflüsse in mehreren Dimensionen, um die Kauf- und Verkaufssituation des Marktes zu beurteilen, und die Signale sind sehr genau.
- Die VCI und MCI sind in der Lage, sich an den Markt in Echtzeit anzupassen, indem sie dynamische Standardabweichungen berechnen.
- Die Strategieparameter wurden durch umfangreiche Rückmessungen optimiert und weisen eine hohe Stabilität auf.
Risikoanalyse
- Die Preis- und Volumenindikatoren wurden mit Verzögerungen berechnet, so dass keine Überraschungen im Voraus erfasst werden konnten.
- Eine einzelne Strategie kann die komplexe und wechselhafte Marktlage nicht vollständig abdecken.
- Der Markt muss in Kombination mit anderen Hilfsindikatoren beurteilt werden, die nicht alleine beurteilt werden können.
Optimierungsrichtung
- In Kombination mit Deep Learning und anderen Vorhersagemodellen, um die Genauigkeit der Signalbeurteilung zu verbessern.
- Erhöhung der Risikokontrollmodule wie Stop-Loss, um die Stabilität der Strategie zu verbessern;
- Versuchen Sie mit verschiedenen Kombinationen von Parametern, um die Anwendbarkeit in bestimmten Märkten zu testen.
Zusammenfassen
Die Strategie, die durch den Vergleich von doppelten CICI-Index Handelssignale bildet, berücksichtigt mehrere Faktoren wie Preis und Handelsvolumen, um die Kaufkraft des Marktes zu bewerten, ist eine typische und praktische quantitative Handelsstrategie. Es ist jedoch wichtig, dass sie in Kombination mit anderen Hilfsmitteln verwendet wird, um die Strategie optimal zu nutzen.
- 1