
Dieser Artikel beschreibt eine quantitative Trading-Strategie, die auf dem Brin-Kanal und dem ADX-Indikator in Kombination mit der K-Linie basiert. Die Strategie verwendet den Brin-Kanal, um Markttrends und -volatilität zu beurteilen, und in Kombination mit dem ADX-Indikator, um Markttrends zu beurteilen.
In Kombination mit dem Brin-Kanal und dem ADX-Indikator kann die Obergrenze eindeutig beurteilt und selektive Positionen erstellt werden, um unnötige Geschäfte in einem erschütternden Umfeld zu vermeiden.
Die Bollinger Bandbreite wird verwendet, um das Volatilitätsrisiko zu beurteilen. Die Bollinger Bandbreite ist ein hohes Risiko, wenn die Bollinger Bandbreite schrumpft.
Die ATR-Stoppschaden-Einstellungen ermöglichen ein kontrollierbares Risiko und verhindern so weit wie möglich, dass die Stoppschaden verfolgt werden.
Nach der Brin-Kanal-Einstellung besteht kein Risiko, dass der Stopp nach oben oder nach unten folgt.
Mobile Stop-Ops sind zeitnahe Stop-Ops nach Gewinn, um Gewinn zu sichern und den Trends zu folgen.
Die Brin-Kanal- und ADX-Indikatoren sind möglicherweise unter Druck geraten. Eine Abweichung kann zu Fehleinschätzungen führen.
Der ATR-Indikator spiegelt nur die historischen Schwankungen wider und kann keine zukünftigen Schwankungen vorhersagen.
Die Verteilung der Brin-Kanal-Gebiete ist subjektiv und es kann zu verpassten Gelegenheiten kommen.
Der mobile Stop-Loss kann nur in der Scheibe durchgeführt werden, es besteht die Gefahr, dass er nicht in der Zeit bewegt werden kann.
Risiko der Datenübereinstimmung. Es ist schwierig, die Testergebnisse auf dem realen Markt zu reproduzieren.
Die Integration von mehr Indikatoren zur Vertrauensbildung verhindert, dass falsche Signale im Brin-Kanal und im ADX-Indikator auftreten.
ATR-Stopps können zusätzlich zu Sprungstopps eingesetzt werden.
Die Optimierung der Kanalparameter des Brin-Kanals ermöglicht es ihm, größere Marktchancen zu nutzen.
Die Anbieter von Bitcoin-Systemen, wie Bitcoin und Ethereum, haben die Möglichkeit, ihre Kunden zu überwachen, um ihre Transaktionen zu überwachen.
Um die Strategie zu stabilisieren, werden Rückprüfungen über längere Zeiträume und mit mehr Varietätskombinationen durchgeführt.
Die Strategie integriert mehrere Indikatorsignale wie den Brin-Kanal, den ADX-Indikator, entscheidet nach der Bestimmung der klaren Trendrichtung, und optimiert die Stop-Loss-Setting mit dem ATR-Indikator, um das Risiko und die Gewinnquote zu minimieren. Eine empfohlene quantitative Handelsstrategie. Wir sehen, dass es noch viel Optimierungsmöglichkeiten für die Strategie gibt und erwarten die Produktion zukünftiger Generationen.
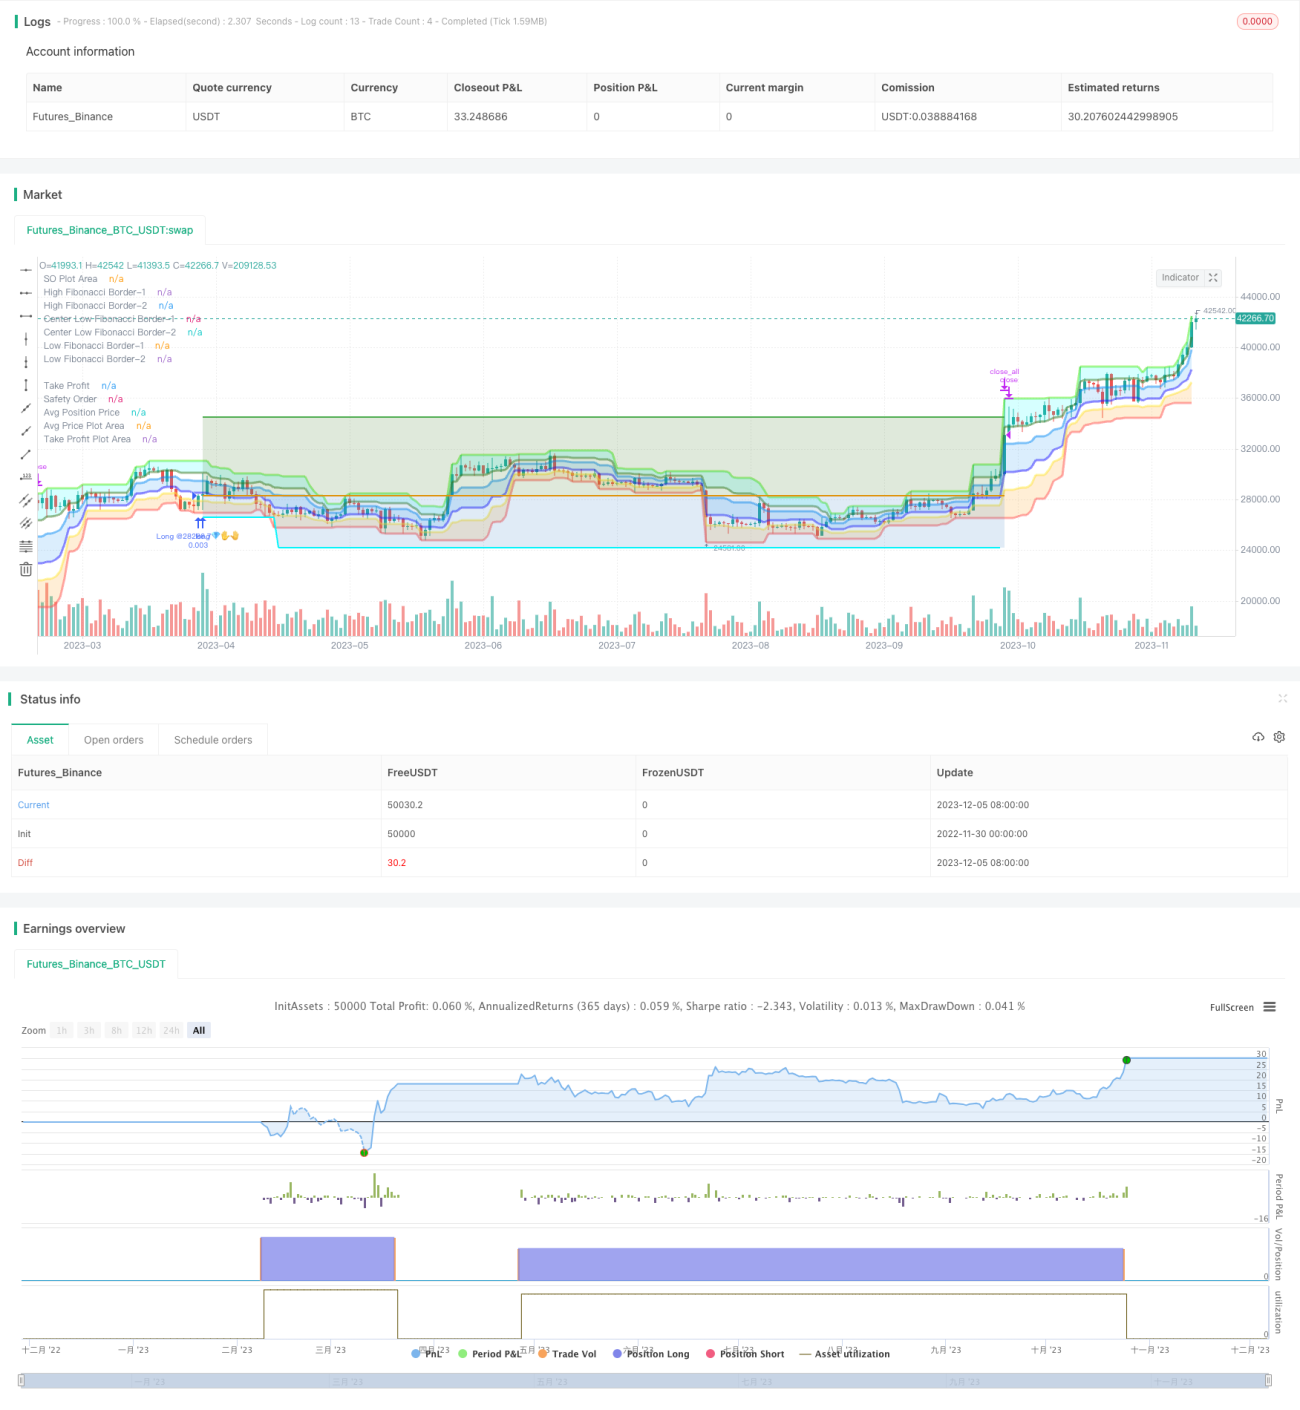
/*backtest
start: 2022-11-30 00:00:00
end: 2023-12-06 00:00:00
period: 1d
basePeriod: 1h
exchanges: [{"eid":"Futures_Binance","currency":"BTC_USDT"}]
*/
// © Fibonacci Zone DCA Strategy - R3c0nTrader ver 2022-06-12
// For backtesting with 3Commas DCA Bot settings
// Thank you "eykpunter" for granting me permission to use "Fibonacci Zones" to create this strategy
// Thank you "junyou0424" for granting me permission to use "DCA Bot with SuperTrend Emulator" which I used for adding bot inputs, calculations, and strategy
//@version=5
strategy('Fibonacci Zone DCA Strategy - R3c0nTrader', shorttitle='Fibonacci Zone DCA Strategy', overlay=true )
// Strategy Inputs
// Start and End Dates
i_startTime = input(defval=timestamp('01 Jan 2015 00:00 +0000'), title='Start Time', group="Date Range")
i_endTime = input(defval=timestamp('31 Dec 2050 23:59 +0000'), title='End Time', group="Date Range")
inDateRange = true
// Fibonacci Settings
sourceInput = input.source(close, "Source", group="Trade Entry Settings")
per = input(14, title='Fibonacci length', tooltip='Number of bars to look back. Recommended for beginners to set ADX Smoothing and DI Length to the same value as this.', group="Trade Entry Settings")
hl = ta.highest(high, per) //High Line (Border)
ll = ta.lowest(low, per) //Low Line (Border)
dist = hl - ll //range of the channel
hf = hl - dist * 0.236 //Highest Fibonacci line
cfh = hl - dist * 0.382 //Center High Fibonacci line
cfl = hl - dist * 0.618 //Center Low Fibonacci line
lf = hl - dist * 0.764 //Lowest Fibonacci line
// ADX Settings
lensig = input.int(14, title="ADX Smoothing", tooltip='Fibonacci signals work best when market is trending. ADX is used to measure trend strength. Default value is 14. Recommend for beginners to match this with Fibonacci length and DI Length',minval=1, maxval=50, group="Trade Entry Settings")
len = input.int(14, minval=1, title="DI Length", tooltip='Fibonacci signals work best when market is trending. DI Length is used to calculate ADX to measure trend strength. Default value is 14. Recommend for beginners to match this with Fibonacci length and ADX Smoothing.', group="Trade Entry Settings")
adx_min = input.int(25, title='Min ADX value to open trade', tooltip='Use this to set the minium ADX value (trend strength) to open trade. 25 or higher is recommended for beginners. 0 to 20 is a weak trend. 25 to 35 is a strong trend. 35 to 45 is a very strong trend. 45 to 100 is an extremely strong trend.', group="Trade Entry Settings")
up = ta.change(high)
down = -ta.change(low)
plusDM = na(up) ? na : (up > down and up > 0 ? up : 0)
minusDM = na(down) ? na : (down > up and down > 0 ? down : 0)
trur = ta.rma(ta.tr, len)
di_plus = fixnan(100 * ta.rma(plusDM, len) / trur)
di_minus = fixnan(100 * ta.rma(minusDM, len) / trur)
sum = di_plus + di_minus
adx = 100 * ta.rma(math.abs(di_plus - di_minus) / (sum == 0 ? 1 : sum), lensig)
fib_choice = input.string("2-Higher than the top of the Downtrend Fib zone", title="Open a trade when the price moves:", options=["1-To the bottom of Downtrend Fib zone", "2-Higher than the top of the Downtrend Fib zone", "3-Higher than the bottom of Ranging Fib Zone", "4-Higher than the top of Ranging Fib Zone", "5-Higher than the bottom of Uptrend Fib Zone", "6-To the top of Uptrend Fib Zone"],
tooltip='There are three fib zones. The options are listed from the bottom zone to the top zone. The bottom zone is the Downtrend zone; the middle zone is the Ranging zone; The top fib zone is the Uptrend zone;',
group="Trade Entry Settings")
di_choice = input.bool(false, title="Only open trades on bullish +DI (Positive Directional Index)? (off for contrarian traders)", tooltip=
'Default is disabled. If you want to be more selective (you want a bullish confirmation), enable this and it will only open trades when the +DI (Positive Directional Index) is higher than the -DI (Negative Directional Index). Contrarian traders (buy the dip) should leave this disabled',
group="Trade Entry Settings")
di_min = input.int(0, title='Min +DI value to open trade',
tooltip='Default is zero. Use this to set the minium +DI value to open the trade. Try incrementing this value if you want to be more selective and filter for more bullish moves (e.g. 20-25). For Contrarian traders, uncheck "Only open trades on bullish DI" option and set Min +DI to zero',
group="Trade Entry Settings")
di_max = input.int(100, title='Max +DI value to open trade', tooltip='Default is 100. Use this to set the maxium +DI value to open trade. For Contrarian traders, uncheck "Only open trades on bullish DI" option and try a Max +DI value no higher than 20 or 25', group="Trade Entry Settings")
di_inrange = di_plus >= di_min and di_plus <= di_max
// Truncate function
truncate(number, decimals) =>
factor = math.pow(10, decimals)
int(number * factor) / factor
//Declare take_profit
take_profit = float(0.22)
// Take Profit Drop-down menu option
tp_choice = input.string("Target Take Profit (%)", title="Take profit using:", options=["Target Take Profit (%)", "High Fibonacci Border-1", "High Fibonacci Border-2"], tooltip=
'Select how to exit your trade and take profit. Then specify below this option the condition to exit. "High Fibonacci Border-1" is the top-most Fibonacci line in the green uptrend zone. "High Fibonacci Border-2" is the bottom Fibonacci line in the green uptrend zone. You can find these lines on the "Style" tab and toggle them off/on to locate these lines for more clarity',
group="Trade Exit Settings")
if tp_choice == "Target Take Profit (%)"
take_profit := input.float(22.0, title='Target Take Profit (%)', step=0.5, minval=0.0, tooltip='Only used if "Target Take Profit (%)" is selected above.', group="Trade Exit Settings") / 100
take_profit
else if tp_choice == "High Fibonacci Border-1"
take_profit := float(hl)
take_profit
else if tp_choice == "High Fibonacci Border-2"
take_profit := float(hf)
take_profit
trailing = input.float(0.0, title='Trailing deviation. Default= 0.0 (%)', step=0.5, minval=0.0, group="Trade Exit Settings") / 100
base_order = input(100.0, title='Base order', group="Trade Entry Settings")
safe_order = input(200.0, title='Safety order', group="Trade Entry Settings")
price_deviation = input.float(6.0, title='Price deviation to open safety orders (%)', step=0.25, minval=0.0, group="Trade Entry Settings") / 100
safe_order_volume_scale = input.float(2.0, step=0.5, title='Safety order volume scale', group="Trade Entry Settings")
safe_order_step_scale = input.float(1.4, step=0.1, title='Safety order step scale', group="Trade Entry Settings")
max_safe_order = input(5, title='Max safety orders', group="Trade Entry Settings")
var current_so = 0
var initial_order = 0.0
var previous_high_value = 0.0
var original_ttp_value = 0.0
// Calculate our key levels
take_profit_level = strategy.position_avg_price * (1 + take_profit)
if tp_choice == "Target Take Profit (%)"
take_profit_level := strategy.position_avg_price * (1 + take_profit)
else
take_profit_level := take_profit
fib_trigger = bool(false)
if fib_choice == "2-Higher than the top of the Downtrend Fib zone"
fib_trigger := ta.crossover(sourceInput, lf)
else if fib_choice == "1-To the bottom of Downtrend Fib zone"
fib_trigger := sourceInput <= ll
else if fib_choice == "3-Higher than the bottom of Ranging Fib Zone"
fib_trigger := ta.crossover(sourceInput, cfl)
else if fib_choice == "4-Higher than the top of Ranging Fib Zone"
fib_trigger := ta.crossover(sourceInput, cfh)
else if fib_choice == "5-Higher than the bottom of Uptrend Fib Zone"
fib_trigger := ta.crossover(sourceInput, hf)
else if fib_choice == "6-To the top of Uptrend Fib Zone"
fib_trigger := sourceInput >= hl
// If option enabled for enter trades only when DI is positive, then open trade based on user settings
if di_choice == true and strategy.position_size == 0 and sourceInput > 0 and inDateRange and fib_trigger and adx >= adx_min and di_plus > di_minus and di_inrange
strategy.entry('Long @' + str.tostring(sourceInput)+'💎✋🤚', strategy.long, qty=base_order / sourceInput)
initial_order := sourceInput
current_so := 1
previous_high_value := 0.0
fib_trigger := false
original_ttp_value := 0
original_ttp_value
// Open First Position when candle source value crosses above the 'Low Fibonacci Border-1'
else if di_choice == false and strategy.position_size == 0 and sourceInput > 0 and inDateRange and fib_trigger and adx >= adx_min and di_inrange
strategy.entry('Long @' + str.tostring(sourceInput)+'💎✋🤚', strategy.long, qty=base_order / sourceInput)
initial_order := sourceInput
current_so := 1
previous_high_value := 0.0
fib_trigger := false
original_ttp_value := 0
original_ttp_value
threshold = 0.0
if safe_order_step_scale == 1.0
threshold := initial_order - initial_order * price_deviation * safe_order_step_scale * current_so
threshold
else if current_so <= max_safe_order
threshold := initial_order - initial_order * ((price_deviation * math.pow(safe_order_step_scale, current_so) - price_deviation) / (safe_order_step_scale - 1))
threshold
else if current_so > max_safe_order
threshold := initial_order - initial_order * ((price_deviation * math.pow(safe_order_step_scale, max_safe_order) - price_deviation) / (safe_order_step_scale - 1))
threshold
// Average down when lowest candle value crosses below threshold
if current_so > 0 and low <= threshold and current_so <= max_safe_order and previous_high_value == 0.0
// Trigger a safety order at the Safety Order "threshold" price
strategy.entry('😨🙏 SO ' + str.tostring(current_so) + '@' + str.tostring(threshold), direction=strategy.long, qty=safe_order * math.pow(safe_order_volume_scale, current_so - 1) / threshold)
current_so += 1
current_so
// Take Profit!
// Take profit when take profit level is equal to or higher than the high of the candle
if take_profit_level <= high and strategy.position_size > 0 or previous_high_value > 0.0
if trailing > 0.0
if previous_high_value > 0.0
if high >= previous_high_value
previous_high_value := sourceInput
previous_high_value
else
previous_high_percent = (previous_high_value - original_ttp_value) * 1.0 / original_ttp_value
current_high_percent = (high - original_ttp_value) * 1.0 / original_ttp_value
if previous_high_percent - current_high_percent >= trailing
strategy.close_all(comment='Close (trailing) @' + str.tostring(truncate(current_high_percent * 100, 3)) + '%')
current_so := 0
previous_high_value := 0
original_ttp_value := 0
original_ttp_value
else
previous_high_value := high
original_ttp_value := high
original_ttp_value
else
strategy.close_all(comment='💰 Close @' + str.tostring(high))
current_so := 0
previous_high_value := 0
original_ttp_value := 0
original_ttp_value
// Plot Fibonacci Areas
fill(plot(hl, title='High Fibonacci Border-1', color=color.new(#53ed0f, 50), linewidth=3), plot(hf, title='High Fibonacci Border-2', color=color.new(#38761d, 50), linewidth=3), color=color.new(#00FFFF, 80), title='Uptrend Fibonacci Zone @ 23.6%') //uptrend zone
fill(plot(cfh, title='Center Low Fibonacci Border-1', color=color.new(#0589f4, 50), linewidth=3), plot(cfl, title='Center Low Fibonacci Border-2', color=color.new(#2018ff, 50), linewidth=3), color=color.new(color.blue, 80), title='Ranging Fibonacci Zone @ 61.8%') // ranging zone
fill(plot(lf, title='Low Fibonacci Border-1', color=color.new(color.yellow, 50), linewidth=3), plot(ll, title='Low Fibonacci Border-2', color=color.new(color.red, 50), linewidth=3), color=color.new(color.orange, 80), title='Downtrend Fibonacci Zone @ 76.4%') //down trend zone
// Plot TP
plot(strategy.position_size > 0 ? take_profit_level : na, style=plot.style_linebr, color=color.green, linewidth=2, title="Take Profit")
// Plot All Safety Order lines except for last one as bright blue
plot(strategy.position_size > 0 and current_so <= max_safe_order and current_so > 0 ? threshold : na, style=plot.style_linebr, color=color.new(#00ffff,0), linewidth=2, title="Safety Order")
// Plot Last Safety Order Line as Red
plot(strategy.position_size > 0 and current_so > max_safe_order ? threshold : na, style=plot.style_linebr, color=color.red, linewidth=2, title="No Safety Orders Left")
// Plot Average Position Price Line as Orange
plot(strategy.position_size > 0 ? strategy.position_avg_price : na, style=plot.style_linebr, color=color.orange, linewidth=2, title="Avg Position Price")
// Fill TP Area and SO Area
h1 = plot(strategy.position_avg_price, color=color.new(#000000,100), title="Avg Price Plot Area", display=display.none, editable=false)
h2 = plot(take_profit_level, color=color.new(#000000,100), title="Take Profit Plot Area", display=display.none, editable=false)
h3 = plot(threshold, color=color.new(#000000,100), title="SO Plot Area", display=display.none, editable=false)
// Fill TP Area and SO Area
fill(h1,h2,color=color.new(#38761d,80), title="Take Profit Plot Area")
// Current SO Area
fill(h1,h3,color=color.new(#3d85c6,80), title="SO Plot Area")