RSI and Stochastic RSI Combination Strategy

Author: ChaoZhang, Date: 2023-12-07 15:44:21
Tags:

img

Overview

The strategy is named RSI and Stochastic RSI Combination Strategy. It combines the advantages of Relative Strength Index (RSI) and Stochastic RSI to identify overbought and oversold opportunities. The strategy works well on 5-minute charts for EOS/BTC and BTC/USDT, not suitable for all cryptocurrencies.

Strategy Logic

The strategy uses both RSI indicator and Stochastic RSI indicator. The RSI parameters are length of 10 periods, overbought level at 60 and oversold level at 20. The Stochastic RSI parameters include smoothing period of K line at 3, smoothing period of D line at 3, RSI calculation length of 14, Stochastic RSI calculation length of 14. It identifies oversold when Stochastic RSI K and D values are both below 20, and overbought when Stochastic RSI K and D values are both above 80. Trading signals are generated at overbought and oversold levels.

Advantage Analysis

The strategy combines the advantages of RSI indicator and Stochastic RSI indicator. RSI is effective at identifying overbought and oversold situations. Stochastic RSI incorporates momentum and can detect turning points earlier. The combination works better by considering both price and momentum factors to generate more timely trading signals.

Risk Analysis

The strategy may face risks of too many trades and insufficient profit margin per trade. Solutions include properly adjusting parameters to lower trading frequency and selecting products with larger price swings. In addition, trading costs can also impact the final profit. It’s recommended to choose trading platforms with lower commissions or appropriately scale up position sizes.

Improvement Directions

Parameters of this strategy can be further optimized, such as adjusting RSI parameters, Stochastic RSI parameters, overbought/oversold threshold values etc. In addition, other indicators like EMA can be combined to filter signals and improve quality. Trying multi-product combinations to utilize correlations between different products can also help obtain more stable overall returns.

Conclusion

The strategy integrates the advantages of RSI indicator and Stochastic RSI indicator to generate trading signals at relative overbought and oversold levels. Parameters can be further tuned and trading rules can be customized for different products. Combinations with other strategies or indicators can also be explored. Overall speaking, this strategy suits quantitative traders looking to identify short-term trading opportunities.


/*backtest
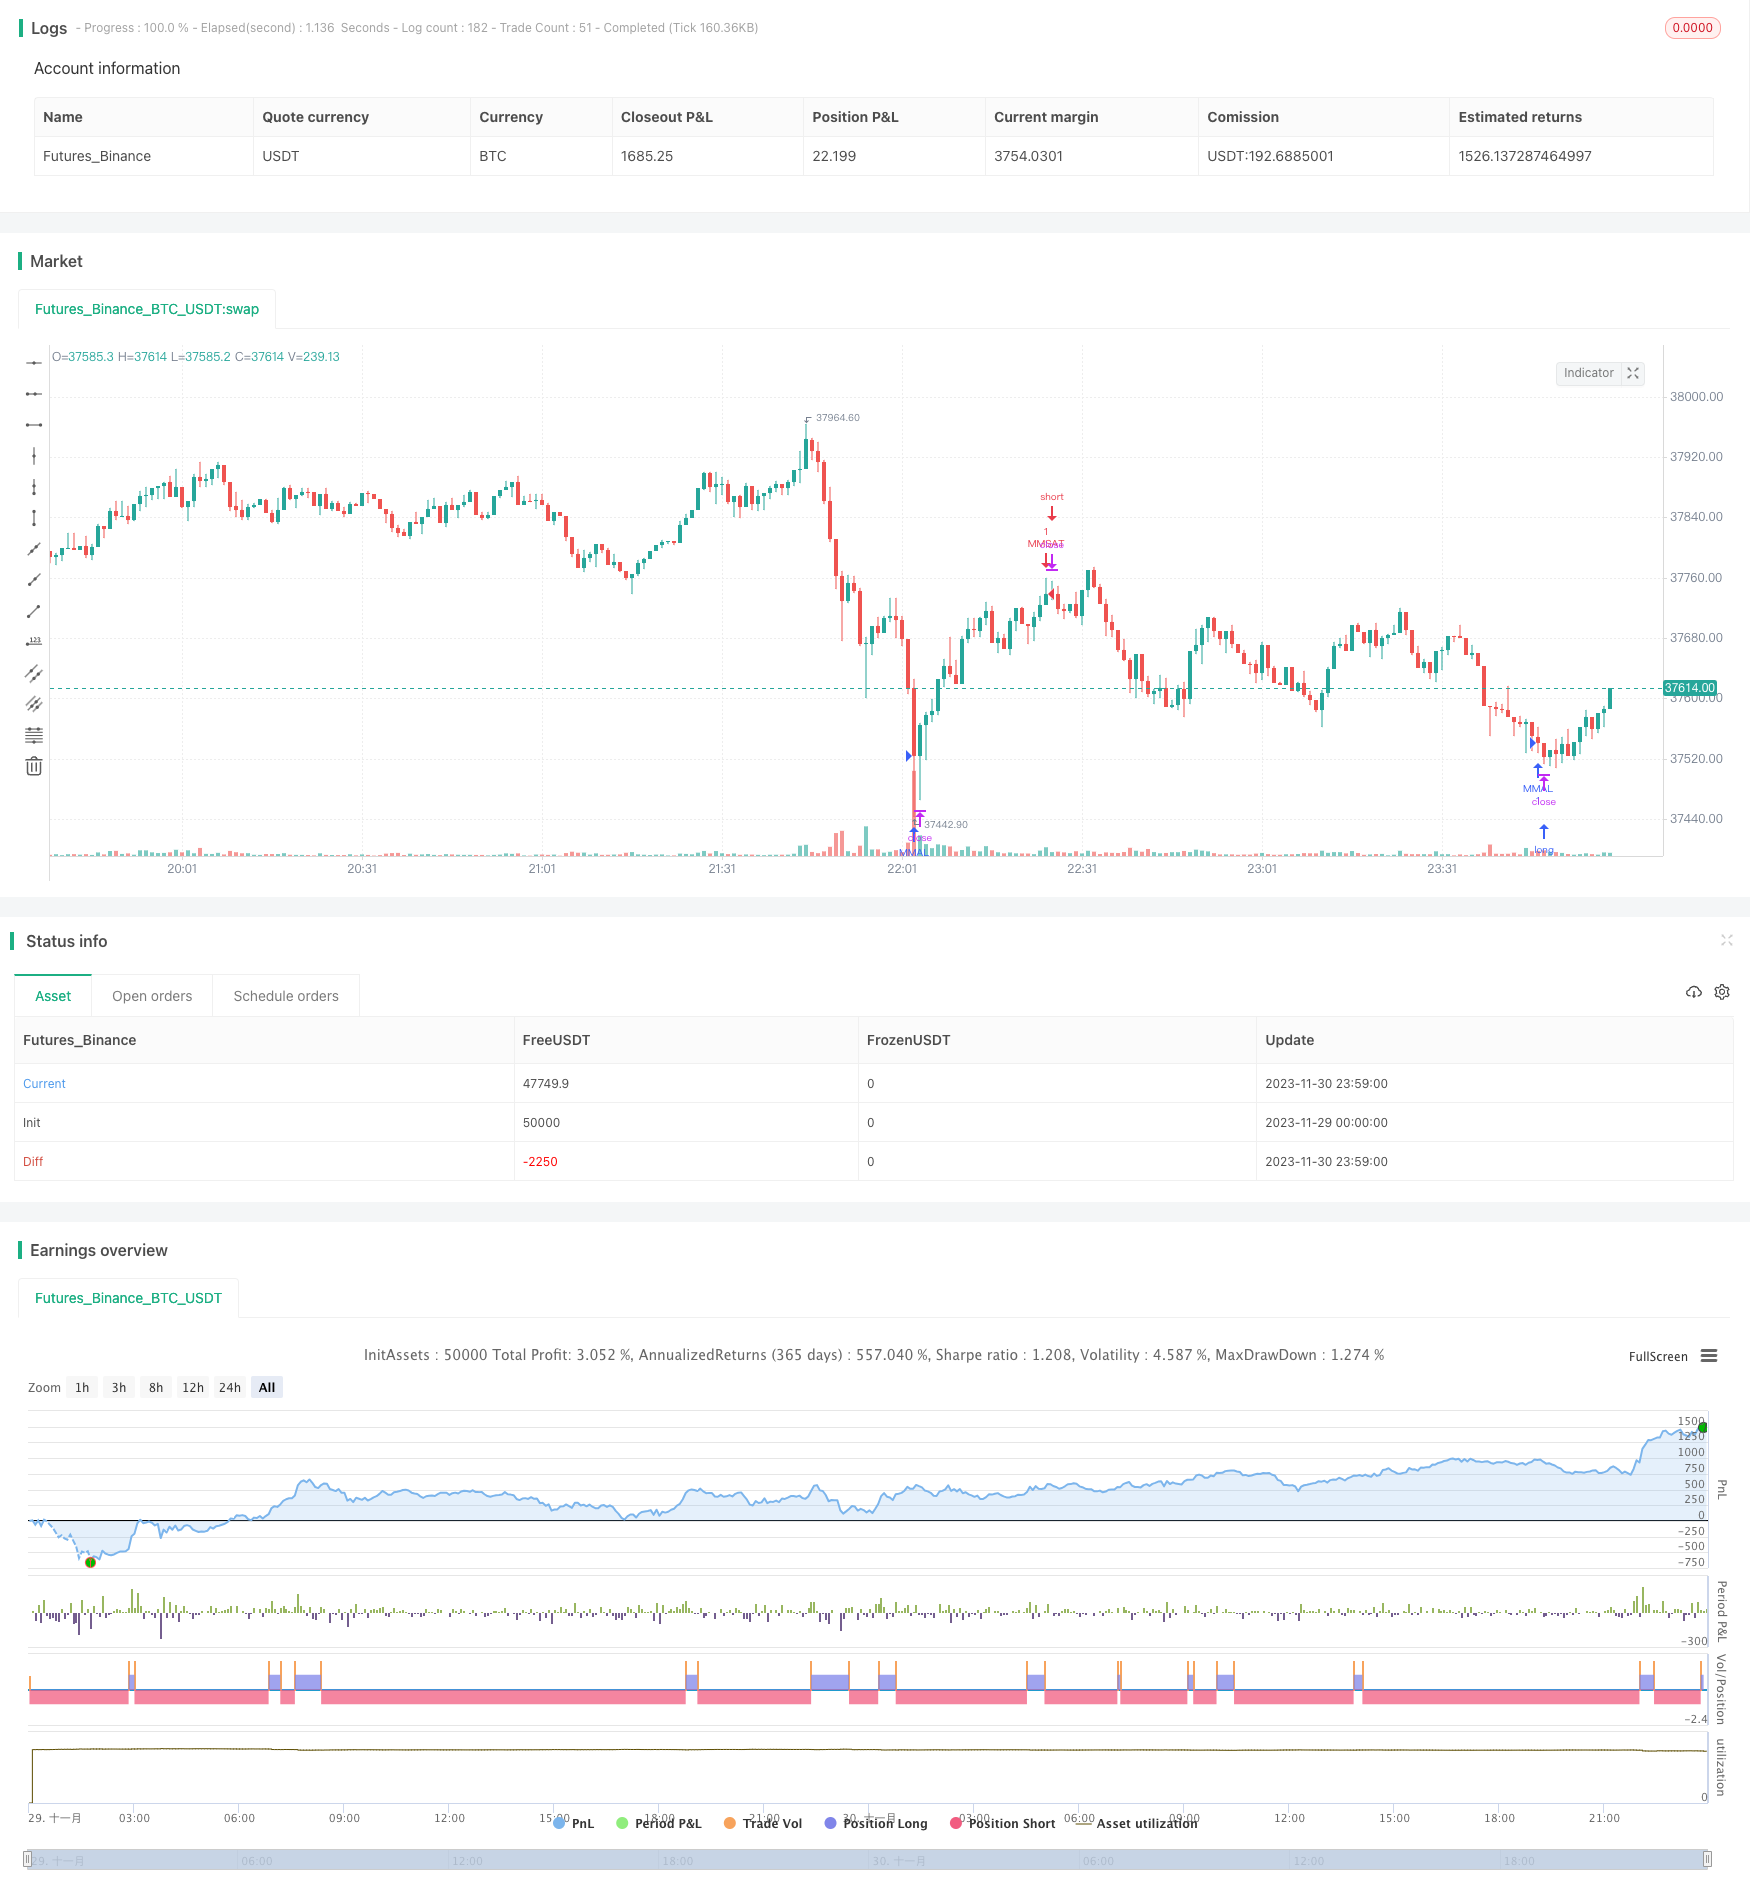
start: 2023-11-29 00:00:00
end: 2023-12-01 00:00:00
period: 1m
basePeriod: 1m
exchanges: [{"eid":"Futures_Binance","currency":"BTC_USDT"}]
*/

//@version=3
strategy("RSI+STOCHRSI", overlay=true)
length = input( 10)
overSold = input( 20 )
overBought = input( 60 )
price = close
vrsi = rsi(price, length)

smoothK = input(3, minval=1)
smoothD = input(3, minval=1)
lengthRSI = input(14, minval=1)
lengthStoch = input(14, minval=1)
src = input(close, title="RSI Source")

rsi1 = rsi(src, lengthRSI)
k = sma(stoch(rsi1, rsi1, rsi1, lengthStoch), smoothK)
d = sma(k, smoothD)
srsilow=input(20)
srsiup=input(80)

sourceup = high
sourcelow = low
source=close


yearfrom = input(2018)
yearuntil =input(2019)
monthfrom =input(1)
monthuntil =input(12)
dayfrom=input(1)
dayuntil=input(31)


if (  (d<srsilow) and (k<srsilow) and (vrsi<overSold)) 
    strategy.entry("MMAL", strategy.long, stop=close, oca_name="TREND", comment="AL")
else
    strategy.cancel(id="MMAL")


if ( (d> srsiup ) and (k>srsiup ) and (vrsi >overBought) )
    strategy.entry("MMSAT", strategy.short,stop=close, oca_name="TREND",  comment="SAT")
else
    strategy.cancel(id="MMSAT")


More