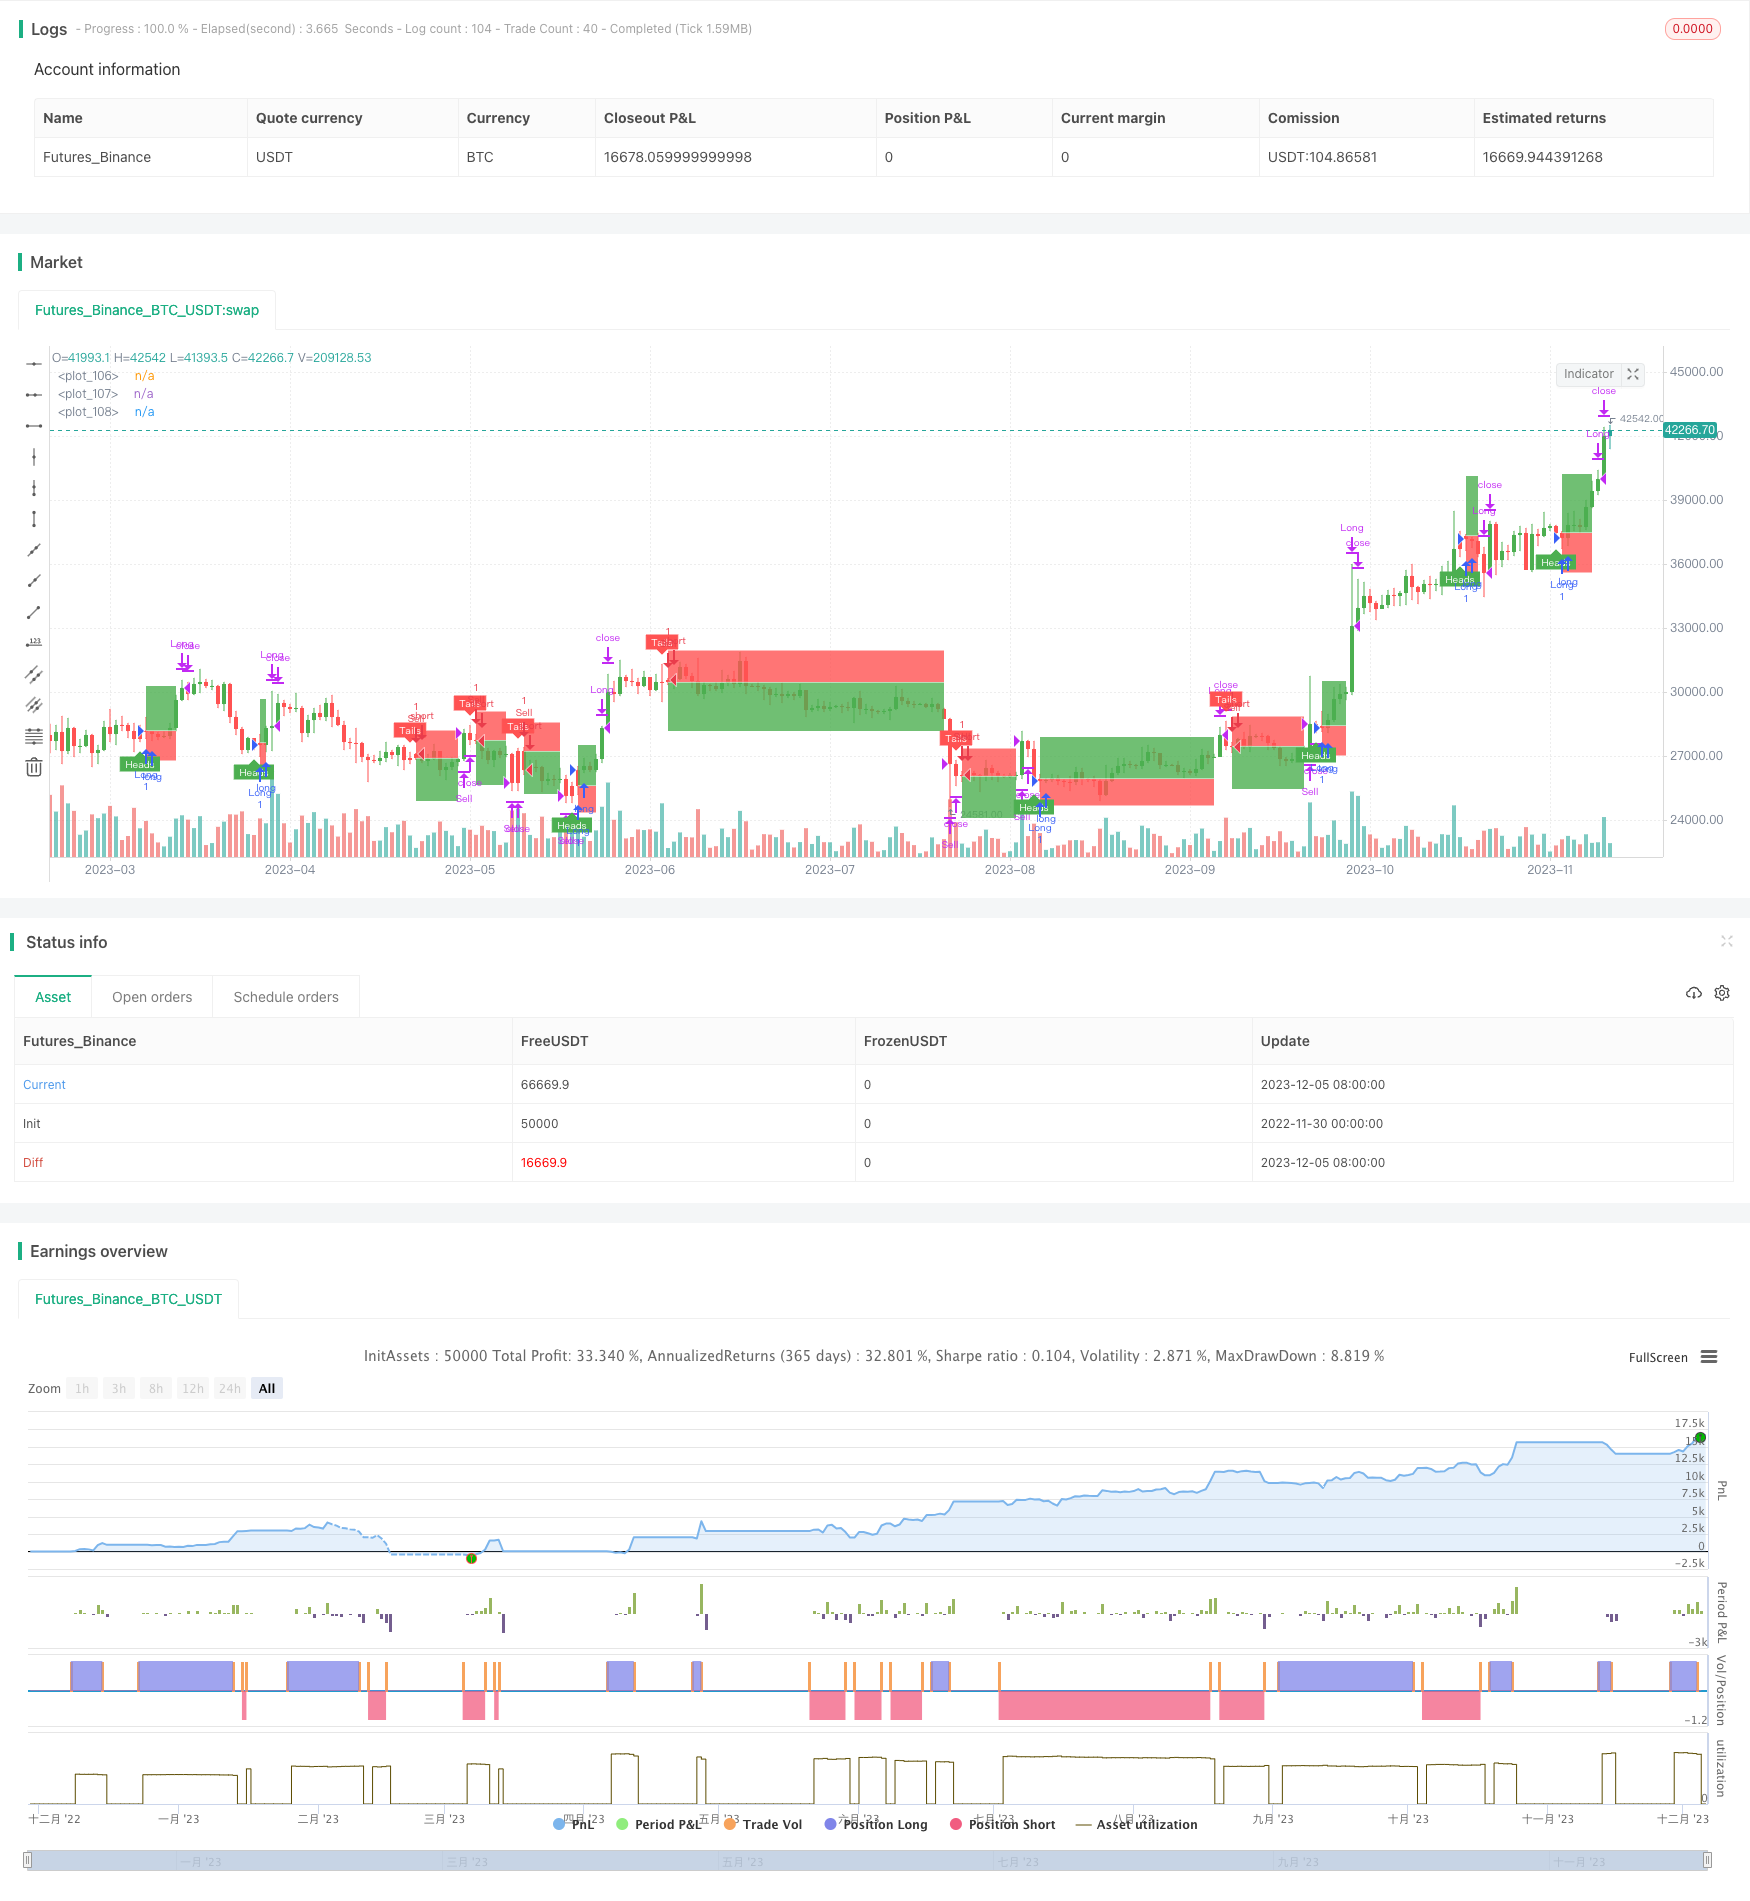
概述
本策略的核心思想是利用随机数模拟硬币掷色子等概率事件,根据事件结果决定做多头或空头,从而实现随机交易。这种交易策略可以用于模拟测试,也可以作为基础框架用于更复杂的策略开发。
策略原理
通过
flip变量模拟随机事件,根据coinLabel随机数大小决定做多或做空。利用
risk和ratio设置止损止盈线。按照设置的最大周期数随机触发下一次交易信号。
通过
plotBox变量控制是否显示平仓盒。stoppedOut和takeProfit变量用于检测止损或止盈。提供回测功能测试策略表现。
优势分析
代码结构清晰,易于理解和二次开发。
UI交互友好,各种参数都可以通过图形界面调整。
随机性强,不受市场波动影响,可靠性高。
可通过参数优化获得更好的收益回报率。
可作为其他策略演示或测试使用。
风险分析
随机交易无法对市场进行判断,存在一定盈利风险。
无法确定最佳参数组合,需要反复测试。
存在因随机信号过于密集而可能带来的超级相关风险。
建议结合止损止盈机制以控制风险。
可通过适当延长交易间隔来降低风险。
优化方向
结合更复杂因子产生随机信号。
增加交易品种,扩大测试范围。
优化 UI 交互,增加策略控制功能。
提供更多测试工具和指标,便于参数优化。
可作为交易信号或止损止盈组件加入到其他策略。
总结
本策略总体框架完整,基于随机事件产生交易信号,可靠性较高。同时提供了参数调整、回测以及绘图功能。既可以用来测试新手开发策略,也可作为其他策略的基础模块。通过适当优化,可以使策略表现更加突出。
策略源码
/*backtest
start: 2022-11-30 00:00:00
end: 2023-12-06 00:00:00
period: 1d
basePeriod: 1h
exchanges: [{"eid":"Futures_Binance","currency":"BTC_USDT"}]
*/

// This source code is subject to the terms of the Mozilla Public License 2.0 at https://mozilla.org/MPL/2.0/
// © melodicfish

//@version=4
strategy("Coin Flipper Pro",overlay=true,max_bars_back=100)

// ======= User Inputs variables=========

h1=input(title="------- Trade Activity -------",defval=false)
maxBars=input(25.0,title="Max Bars between Coin Filps",step=1.0,minval=4.0)

h2=input(title="------- Position Settings -------",defval=false)
risk=input(defval=5.0,title="Risk in % ",type=input.float, minval=0.001 ,step=0.1)
ratio= input(defval=1.5,title="Risk to Reward Ratio x:1 ",type=input.float, minval=0.001,step=0.1)

h3=input(title="------- Plot Options -------",defval=false)
showBox=input(defval=true, title="Show Position Boxes")

h4=input(title="------- Back Testing -------",defval=false)
runTest=input(defval=true, title="Run Strategy Back Test")
customTime=input(defval=false, title="Use Custom Date Range for back test")


tsYear = input(2021,minval=1000,maxval=9999,title= "Test Start Year")
tsMonth = input(1,minval=1,maxval=12,title= "Test Start Month")
tsDay = input(1,minval=1,maxval=31,title= "Test Start Day")
start = timestamp(tsYear,tsMonth,tsDay,0,0)

teYear = input(2021,minval=1000,maxval=9999,title=  "Test Stop Year")
teMonth = input(5,minval=1,maxval=12,title=  "Test Stop Month")
teDay = input(1,minval=1,maxval=31,title=  "Test Stop Day")
end = timestamp(teYear,teMonth,teDay,0,0)

// ======= variables =========
var barsBetweenflips=25
var coinFlipResult=0.0
var flip=true
var coinLabel=0.0
var stoppedOut= true
var takeProfit=true
var posLive=false
var p1=0.0
var p2=0.0
var p3=0.0
var plotBox=false
var posType=0
long=false
short=false


// ===== Functions ======

getColor() =>
    round(random(1,255))


// ===== Logic ========
if barssince(flip==true)>barsBetweenflips and posLive==false
    flip:=true
    coinLabel:=random(1,10)

    // Candle Colors
candleColor= flip==true and flip[1]==false and barstate.isconfirmed==false?color.rgb(getColor(),getColor(),getColor(),0):flip==false and close>=open?color.green:color.red
candleColor:= barstate.ishistory==true and close>=open?color.green: barstate.ishistory==true and close<open? color.red:candleColor
barcolor(candleColor)

if flip[1]==true and posLive==false
    flip:=false
    barsBetweenflips:=round(random(3,round(maxBars)))
    posLive:=true

long:= flip[1]==true and coinLabel[1]>=5.0
short:= flip[1]==true and coinLabel[1]<5.0


    // Calculate Position Boxes
if long==true and posType!=1

    riskLDEC=1-(risk/100)
    p1:= close[1]*(1+((risk/100)*ratio)) // TargetLine
    p2:=close[1]
    p3:= close[1]*riskLDEC // StopLine
    plotBox:=true
    posType:=1

if short==true and posType!=-1

    riskSDEC=1-((risk*ratio)/100)
    p1:= close[1]*riskSDEC   // TargetLine
    p2:=close[1]
    p3:= close[1]*(1+(risk/100)) // StopLine
    plotBox:=true
    posType:=-1


    // Check Trade Status
stoppedOut:= posType==1 and long==false and low<= p3? true: posType==-1 and short==false and high>=p3? true: false
takeProfit:= posType==1 and long == false and high>= p1? true: posType==-1 and short==false and low<=p1? true: false
if stoppedOut==true or takeProfit==true
    posType:=0
    plotBox:=false
    posLive:=false


// ====== Plots ========
plot1=plot(plotBox and showBox? p1:na,style=plot.style_linebr,color=color.white, transp= 100)
plot2=plot(plotBox and showBox? p2:na,style=plot.style_linebr,color=color.white, transp= 100)
plot3=plot(plotBox and showBox? p3:na,style=plot.style_linebr,color=color.white, transp= 100)
fill(plot1,plot2,color= color.green)
fill(plot2,plot3,color= color.red)
plotshape(flip==true and flip[1]==false and coinLabel>=5.0,style=shape.labelup,location=location.belowbar, color=color.green,size=size.tiny,title="short label",text="Heads",textcolor=color.white)
plotshape(flip==true and flip[1]==false and coinLabel<5.0,style=shape.labeldown,location=location.abovebar, color=color.red,size=size.tiny,title="short label",text="Tails",textcolor=color.white)
if stoppedOut==true
    label.new(bar_index-1, p3, style=label.style_xcross, color=color.orange)
if takeProfit==true
    label.new(bar_index-1, p1, style=label.style_flag, color=color.blue)


if runTest==true and customTime==false or runTest==true and customTime==true and time >= start and time <= end
    strategy.entry("Sell", strategy.short,when=short==true)
    strategy.close("Sell", comment="Close Short", when=stoppedOut==true or takeProfit==true)
    strategy.entry("Long", strategy.long,when=long==true)
    strategy.close("Long",comment="Close Long", when= stoppedOut==true or takeProfit==true )