EMAskeletonstrategy

Overview
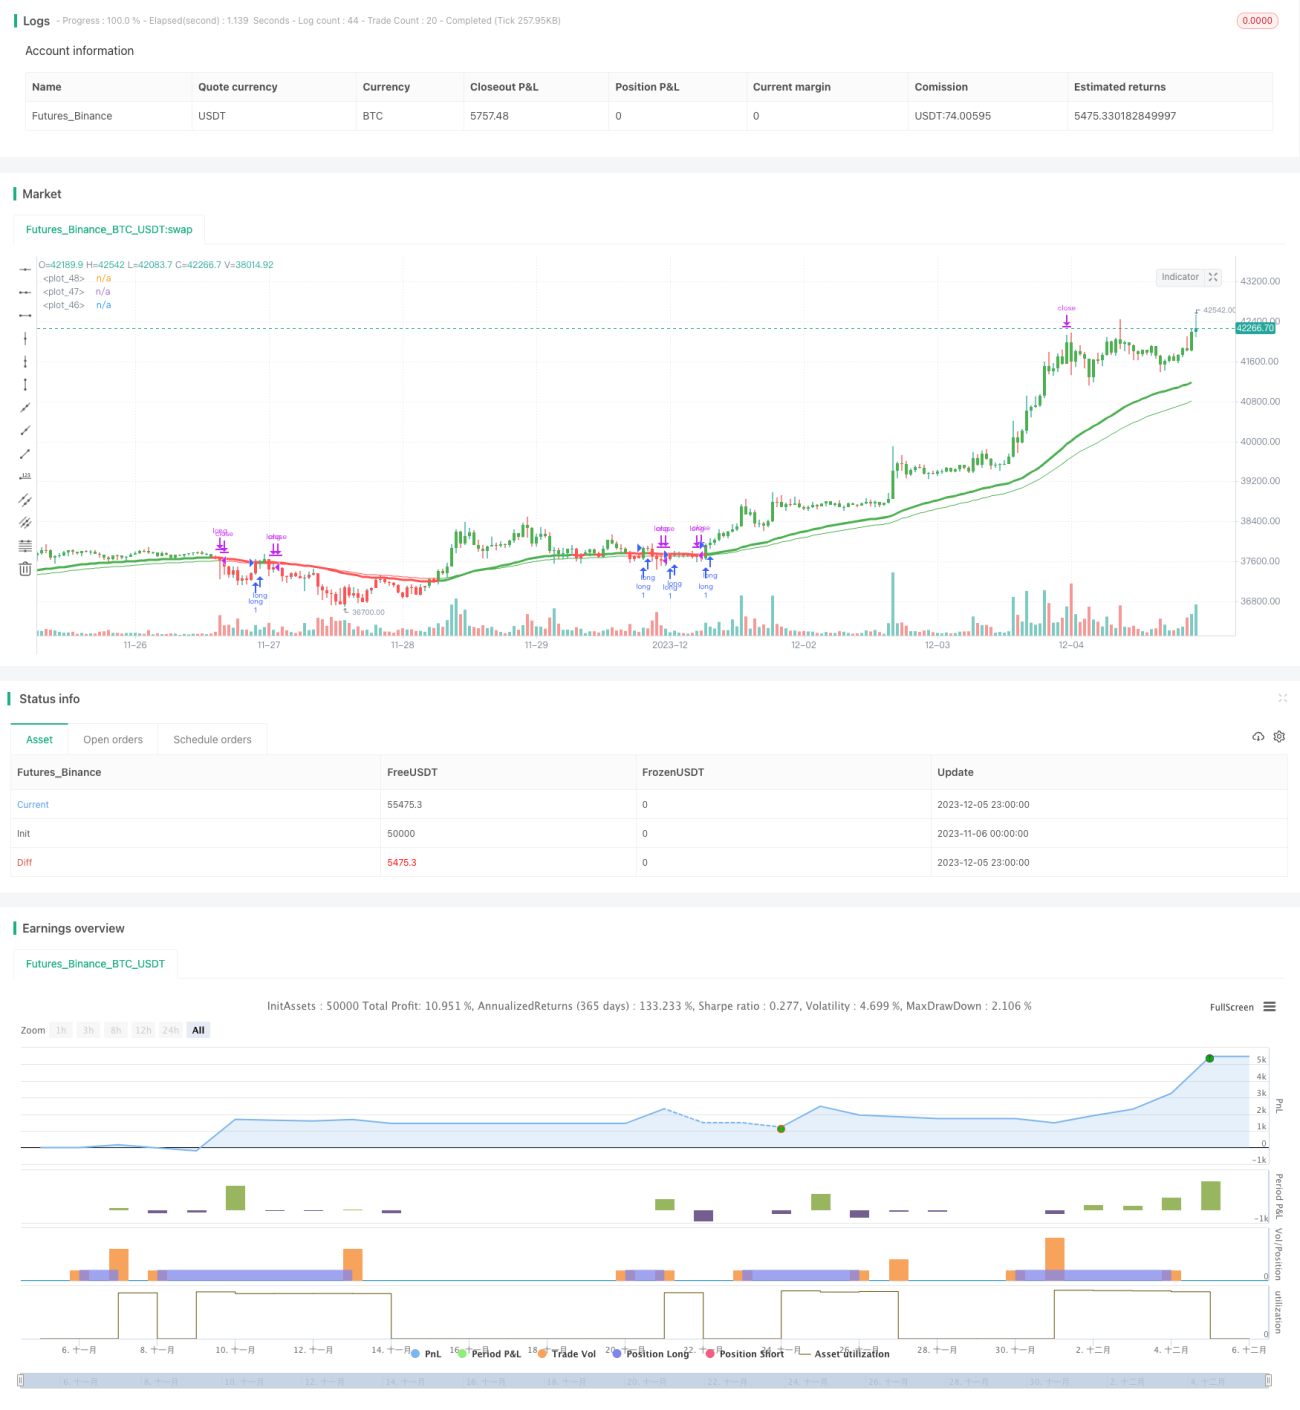
This strategy combines the EMA and RSI indicators to identify short-term adjustment opportunities in Bitcoin. It mainly uses the EMA as the main graphical tool and the RSI as an auxiliary judgment indicator to find obvious adjustment patterns. Trading signals are generated when the price breaks below or climbs back above the EMA line. It also has stop loss and take profit controls that can be parameterized.
Strategy Principle
The strategy mainly uses the 50-period EMA line and the 25-period RSI indicator. The EMA line is regarded as the main graphical indicator and the RSI is used to determine overbought and oversold conditions to assist in generating trading signals. A sell signal is generated when the price falls below the EMA line, and a buy signal is generated when the price breaks above the EMA line and the RSI indicator shows a non-overbought signal (RSI value less than 70). To reduce the chance of wrong entries, the strategy also incorporates a longer-period EMA line (such as 70 periods) as an additional filter condition.
After entering a trade, the strategy also sets stop loss and take profit levels. The stop loss distance is adjustable, defaulting to 5.1%; the take profit distance is also adjustable, defaulting to 9.6%. This effectively limits the maximum loss per trade.
In summary, the strategy mainly relies on EMA line patterns, supplemented by RSI indicators to avoid overbought and oversold conditions, while having stop loss and take profit controls. It is suitable for capturing short-term BT Bitcoin adjustments.
Advantage Analysis
The main advantages of this strategy are:
-
The strategy signals are relatively clear without too many random wrong entries. The combination of EMA and RSI makes the signals more reliable rather than relying solely on a single indicator.
-
Built-in stop loss and take profit control. This effectively limits the loss per trade and is a very important risk control tool.
-
The strategy parameters can be optimized. EMA length, RSI length and more are adjustable parameters. Users can find the optimal parameter sets for different market conditions.
-
Backtesting enabled. The strategy allows setting a backtest date range internally to verify performance.
Risk Analysis
The strategy also has some risks, mainly from:
-
BT Bitcoin has volatile moves, stops may be run. Although stops are set, BT Bitcoin often has large price swings that can take out stops leading to larger-than-expected losses.
-
Drawdown risk. The strategy does not consider overall drawdown control. It may experience drawdowns during prolonged adjustment periods.
-
Weaker signals in strong trends. BT Bitcoin trends can become quite extended during certain market conditions. The short-term signals tend to underperform leading to being stopped out of good trades.
To control and mitigate these risks:
-
Allow wider stop loss ranges. During strong trending conditions, the stop loss range can be widened, such as to 10%, to avoid being stopped out prematurely.
-
Add other indicator filters. Trend-following indicators can be added to avoid taking trades during prolonged consolidation periods.
-
Optimize parameters. Test parameter sets across different market conditions. Switch parameter sets when strong trends emerge to improve signal quality.
Optimization Directions
There is further room to optimize this strategy:
-
Add overall drawdown control. Could set a maximum drawdown percentage, such as 20%, that pauses trading when reached to limit losses.
-
Limit entry frequency. Can restrict the number of trades per unit time, such as 2 trades per hour max, to prevent over-trading.
-
Optimize parameters. Test parameter combinations for different market conditions. Create parameter templates to switch between in real-time matching current conditions.
-
Combine with other indicators. Integrate trend, volatility and other metrics to create more comprehensive trading system entry rules.
Summary
Overall, the strategy mainly relies on short-term BT Bitcoin adjustment patterns, using the EMA and RSI to generate clear trading signals, while having stop loss and take profit controls. It can effectively capture short-term slippage profit opportunities. But works best in combination with other strategies to produce more consistent excess returns.
- 1