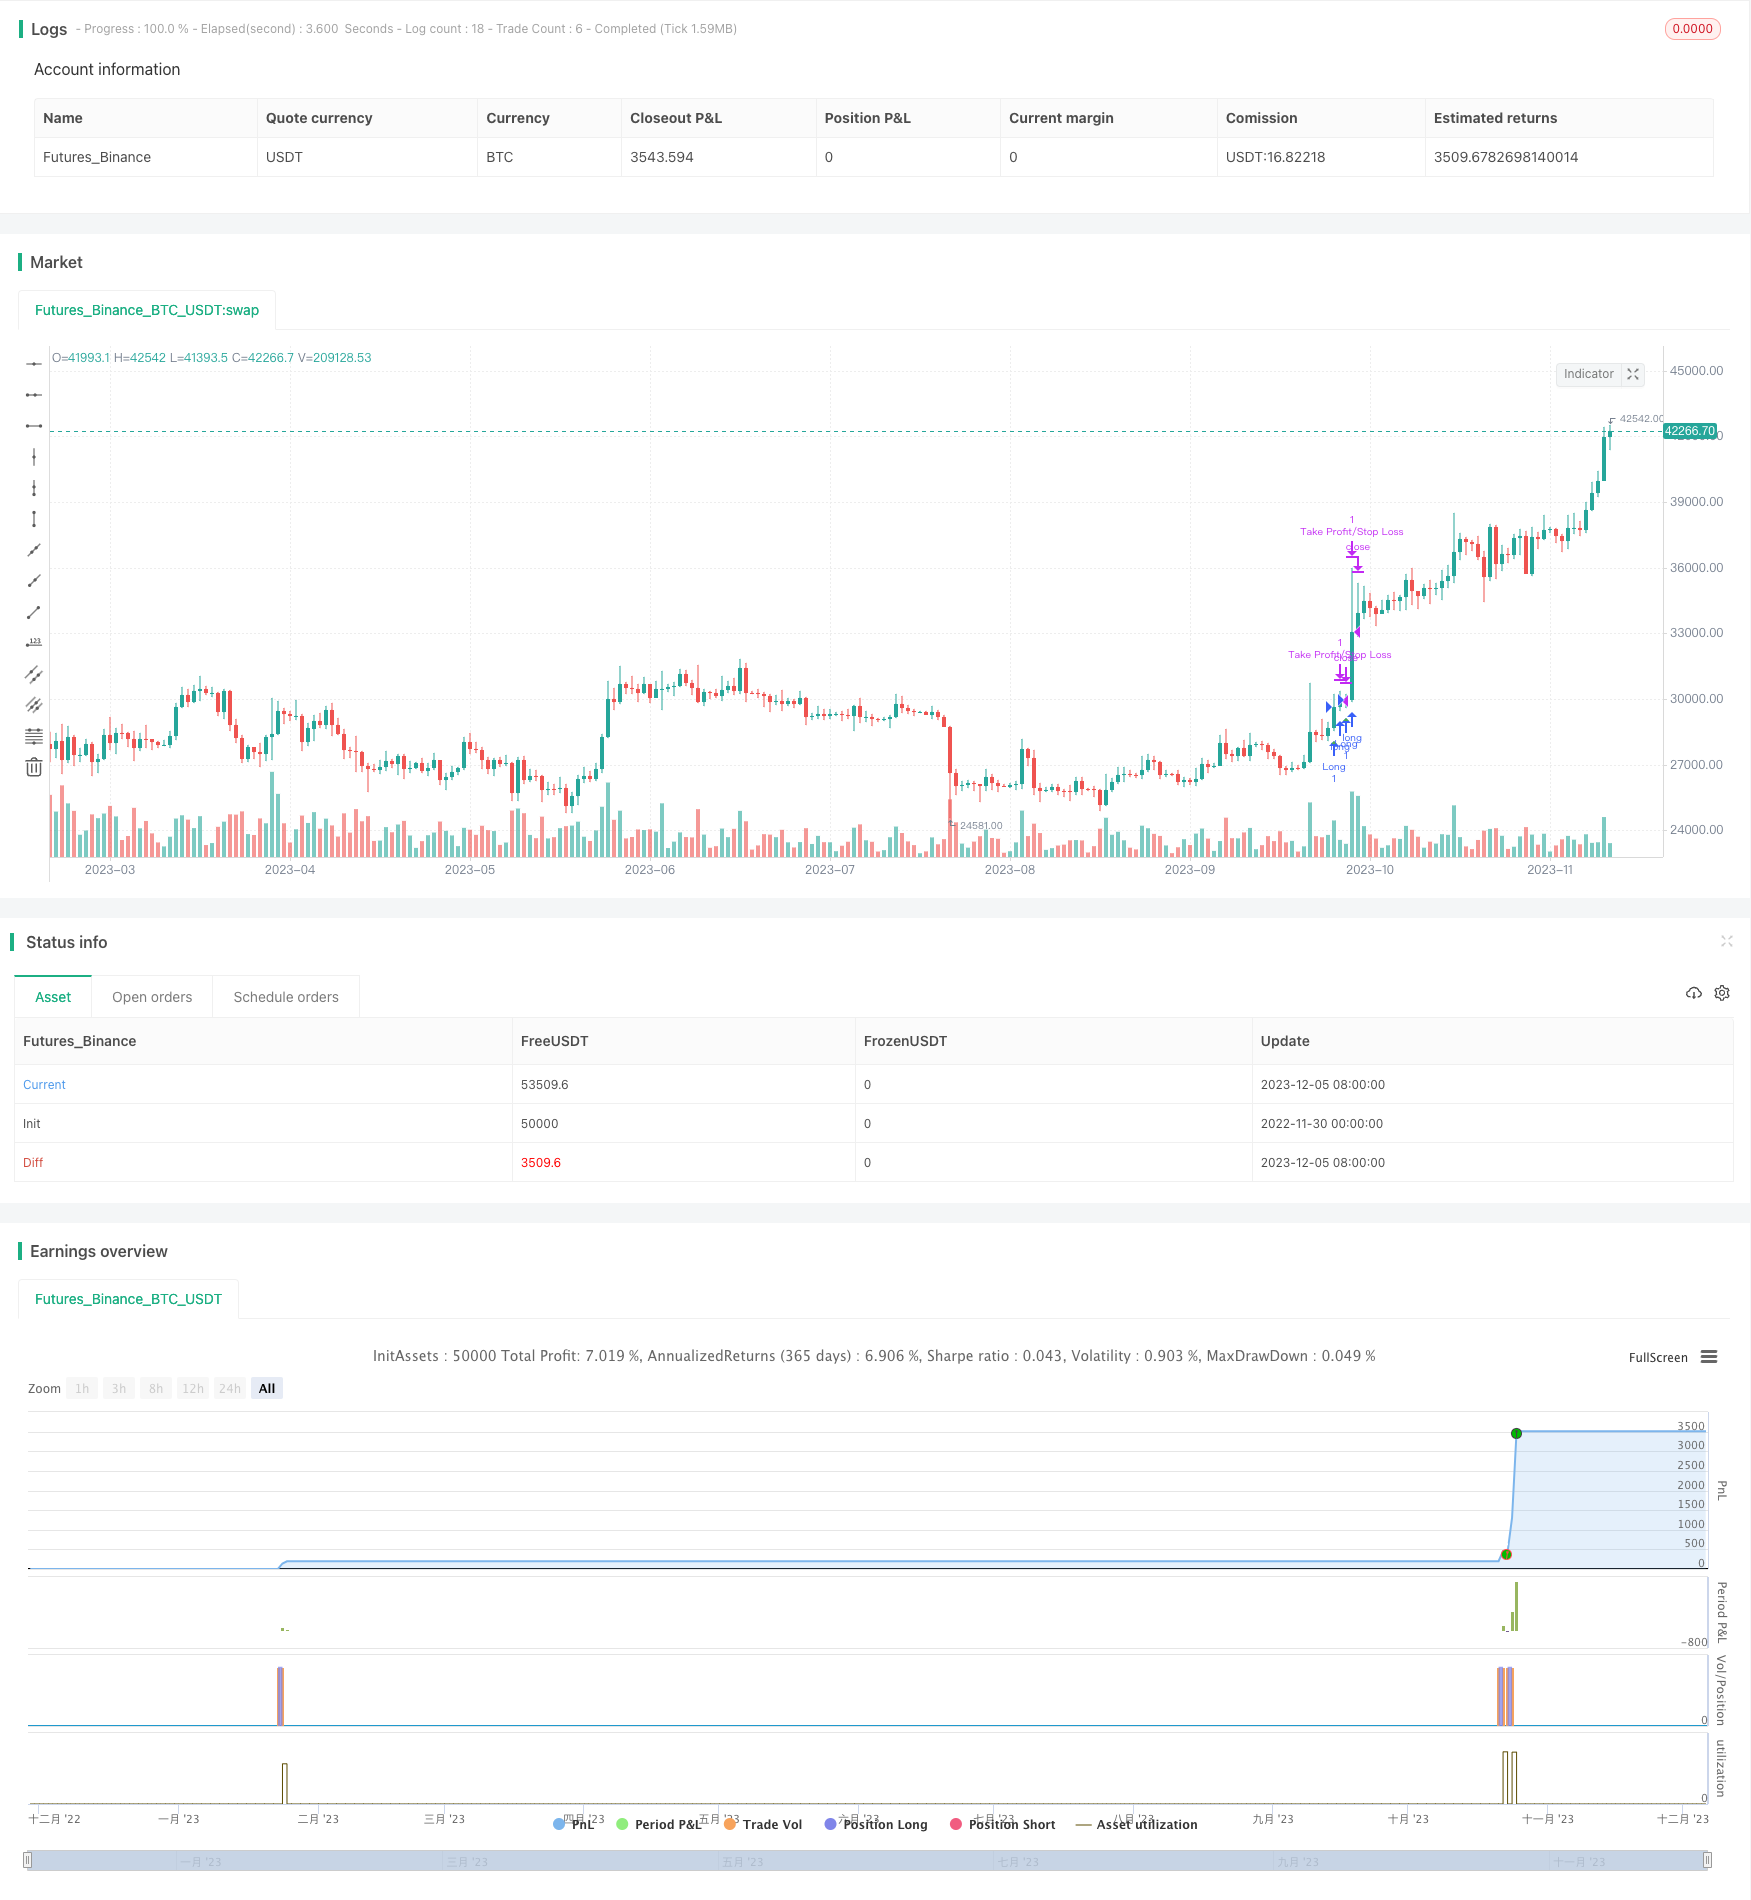
概述
该策略是一个基于SAR指标、CCI指标和EMA指标组合的黄金M5交易策略。它综合利用了三种不同的技术指标来识别黄金的趋势方向和超买超卖情况,以捕捉中间回调提供的交易机会。
策略原理
SAR指标用于判断黄金的趋势方向和可能的反转点。当SAR点下降穿过价格时,表示多头趋势形成;当SAR点上涨穿过价格时,表示空头趋势形成。
CCI指标用于判断市场的超买超卖情况。CCI大于100时表示多头趋势加强,CCI小于-100时表示空头趋势加强。
EMA快慢线组合用于判断价格中短期的转折点。快线上涨时有利于做多,快线下跌时有利于做空。
具体入场规则:当SAR指标向上穿过5分钟EMA均线,CCI指标大于100时做多黄金;当SAR指标向下穿过5分钟EMA均线,CCI指标小于-100时做空黄金。
止损 EXIT 规则:止盈点为开仓价格加7个点,止损点为1分钟EMA均线。
策略优势分析
该策略综合运用了三种指标识别趋势方向和重要支持阻力,提高了获利概率。
CCI指标可以有效过滤常见的假突破。SAR反转点与趋势方向判断相结合,避免在震荡市中反复开仓。
EMA快慢线交叉以及与SAR指标的组合运用,可以有效识别价格短期调整提供的低风险交易机会。
策略参数经过优化,适合黄金这种高波动品种,也适用于小额账户。
风险分析
该策略主要基于技术指标,如果遇到重大黑天鹅事件,技术指标失效的概率较大。
黄金这类商品波动较大,止损点设定为EMA均线,可能会被突破止损,给账户带来较大的单笔损失。
CCI指标和SAR指标都可能产生假信号,这会导致不必要的亏损。
如果遇到剧烈行情,交易系统平台故障的概率会增加,可能会造成无法止损。
优化方向
可以测试不同参数组合优化CCI指标参数,使其更符合黄金的特点。
可以结合更多指标,例如K线形态,布林带等来提升策略稳定性。
可以通过机器学习等手段来动态优化SAR指标的参数,使其更好地适应市场的变化。
可以测试不同的止损方式,例如跟踪止损,降低止损被击穿的概率。
可以优化仓位管理,例如固定份额,动态调整做单量等方式来控制单笔损失。
总结
该策略整体来说是一种较为稳定的黄金交易策略。它结合多种指标来识别黄金的趋势方向、重要的支持阻力位以及超买超卖区域。在回调过程中打开仓位,利用黄金的高波动率获利。同时策略参数也进行了优化,可用于小额账户盘面交易。但该策略也存在一定的风险,建议进行适当的风险管理。如果进一步优化,该策略的稳定性和盈利能力还具有很大的提升空间。
/*backtest
start: 2022-11-30 00:00:00
end: 2023-12-06 00:00:00
period: 1d
basePeriod: 1h
exchanges: [{"eid":"Futures_Binance","currency":"BTC_USDT"}]
*/

//@version=4
strategy("Parabolic SAR and CCI Strategy with EMA Exit", overlay=true)

// Parameters
length = input(50, title="EMA Length")
length_21 = input(21, title="EMA Length 21")
acc = input(0.02, title="Acceleration Factor")
max_acc = input(0.2, title="Max Acceleration Factor")
takeProfitPoints = input(7, title="Take Profit Points")

// Variables
var float ep = 0.0
var float sar = 0.0
var float af = acc

// Calculating 5-minute EMA based on 1-minute data
var float sum_close = na
var float ema_5min = na
if (bar_index % 5 == 0)
    sum_close := 0.0
    for i = 0 to 4
        sum_close := sum_close + close[i]
    ema_5min := ema(sum_close / 5, length_21)

// Calculating 1-minute EMA
ema1 = ema(close, length)
cci = cci(close, 45)

// Custom Parabolic SAR Calculation
trendUp = close > ema1
trendDown = close < ema1

var float prev_sar = na
prev_sar := na(sar[1]) ? low[1] : sar[1]

if trendUp
    ep := high > ep ? high : ep
    af := min(af + acc, max_acc)
    sar := min(prev_sar, prev_sar + af * (ep - prev_sar))

if trendDown
    ep := low < ep ? low : ep
    af := min(af + acc, max_acc)
    sar := max(prev_sar, prev_sar + af * (ep - prev_sar))

// Entry Conditions
longCondition = sar > ema1 and ema1 > ema_5min and cci > 100
shortCondition = sar < ema1 and ema1 < ema_5min and cci < -100

// Exit Conditions
longTakeProfit = strategy.position_avg_price + takeProfitPoints * syminfo.mintick
longStopLoss = ema1
shortTakeProfit = strategy.position_avg_price - takeProfitPoints * syminfo.mintick
shortStopLoss = ema1

// Plotting Entry Points
plotshape(longCondition, style=shape.triangleup, location=location.belowbar, color=color.green, size=size.small)
plotshape(shortCondition, style=shape.triangledown, location=location.abovebar, color=color.red, size=size.small)

// Strategy Execution
if longCondition
    strategy.entry("Long", strategy.long)

if shortCondition
    strategy.entry("Short", strategy.short)

if strategy.position_size > 0
    strategy.exit("Take Profit/Stop Loss", "Long", limit=longTakeProfit, stop=longStopLoss)

if strategy.position_size < 0
    strategy.exit("Take Profit/Stop Loss", "Short", limit=shortTakeProfit, stop=shortStopLoss)