RSI-Trend folgt der Trailing-Stop-Strategie

Überblick
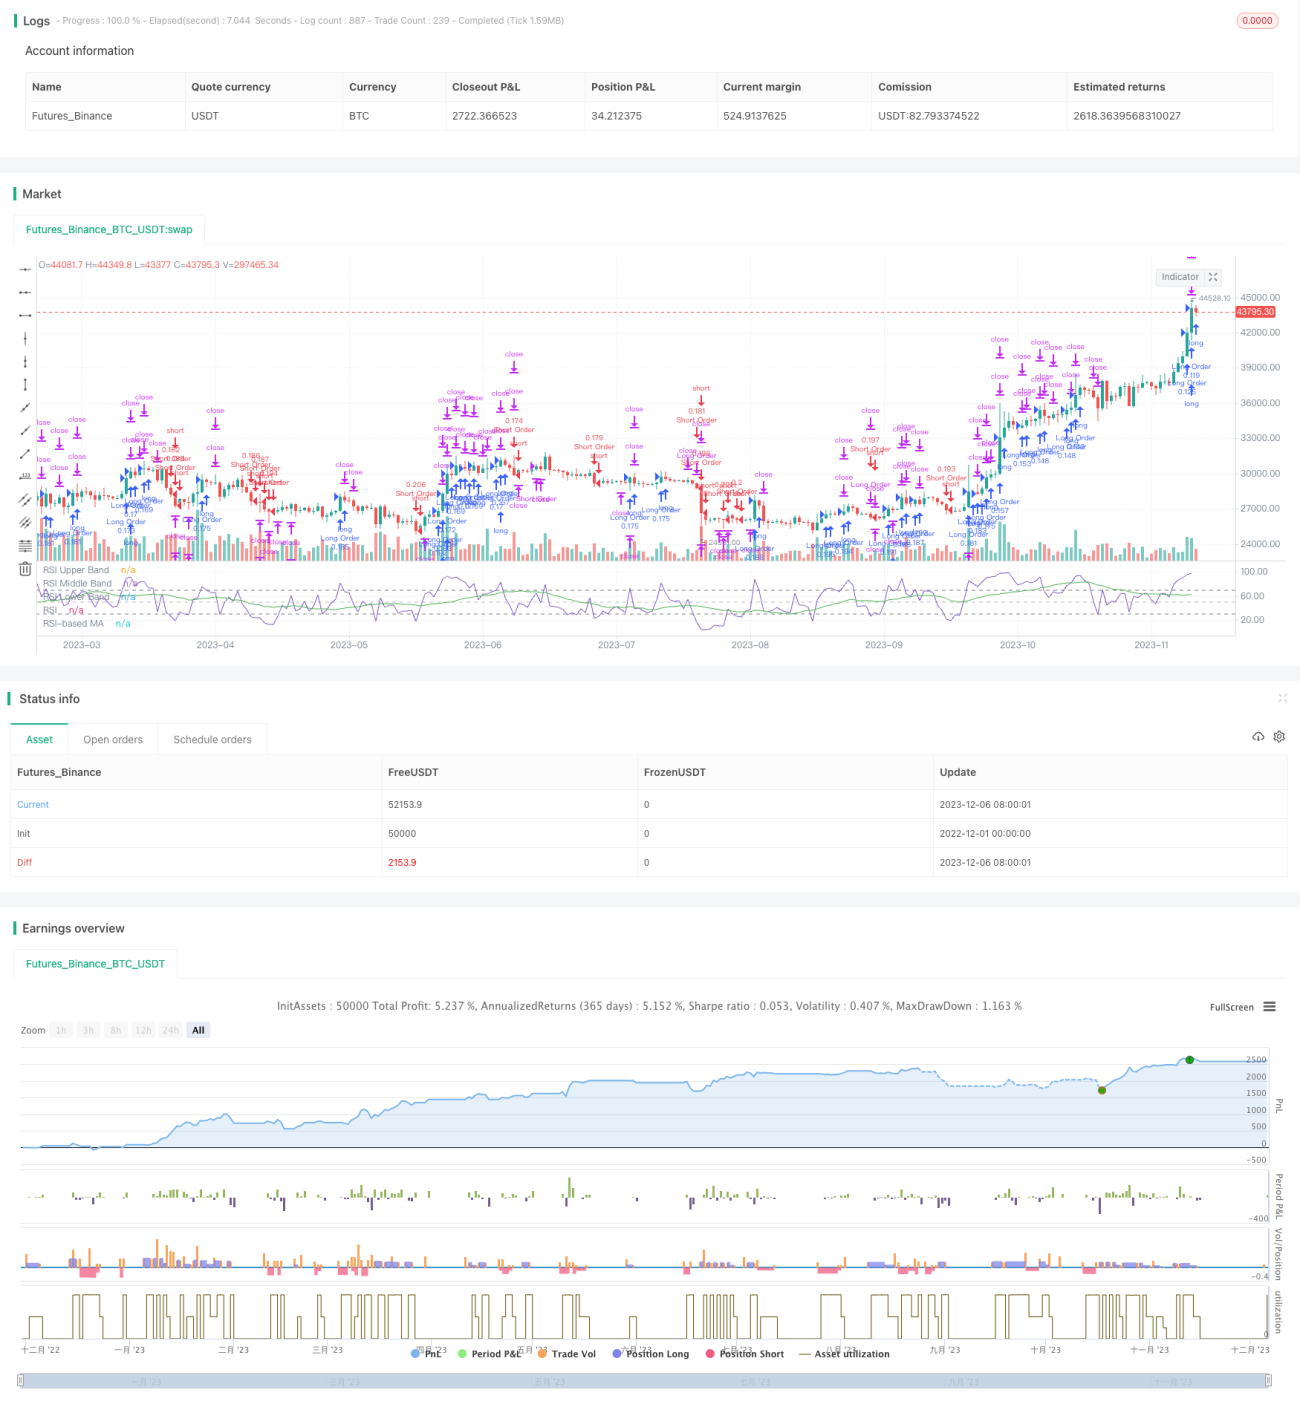
Die Strategie ist eine automatische Handelsstrategie, bei der der RSI-Indikator Trends identifiziert und in Kombination mit dem Moving Average eine Trendbestätigung durchführt, um einen Stop-Loss-Stillstand zu setzen. Wenn der RSI größer als 68 ist und der Moving Average vor dem Durchbruch des aktuellen Moving Average liegt, machen Sie mehr; wenn der RSI kleiner als 28 ist und der Moving Average vor dem Durchbruch des aktuellen Moving Average liegt, machen Sie nichts.
Strategieprinzip
Die Strategie verwendet hauptsächlich die RSI-Anzeige, um überkaufte und überverkaufte Trends zu erkennen. Wenn der RSI größer als 70 ist, ist es eine Überkaufzone, wenn er kleiner als 30 ist, ist es eine Überverkaufszone.
Mehrköpfige Signale: Der RSI ist größer als 68 und bewegt sich über den aktuellen Moving Average, bevor er den Moving Average durchbricht.
Hohes Signal: Der RSI ist kleiner als 28 und unterhalb des aktuellen Moving Averages, bevor der Moving Average durchbrochen wird.
Die Stop-Loss-Stopp-Einstellungen setzen für jeden Punkt eine unterschiedliche Stop-Loss-Ratio ein, von lockerer bis strenger, und zwar:
Mehrköpfige Stop-Off: 1,4% Stop-Off auf die Hälfte der Positionen, 0,8% Stop-Off auf die Hälfte der Positionen.
Mehrfache Stop-Loss: 2% des Eintrittspreises.
Hoher Stop: 0,4% an den niedrigsten Punkten halbe Position, 0,8% an den niedrigsten Punkten vollständige Position.
Leerstand: 2% des Einstiegspreises.
Wenn der Trend umgekehrt wird, beispielsweise wenn der RSI bei 30 brechen wird, ist der Marktpreis vollständig ausgeglichen. Wenn der RSI bei 60 brechen wird, ist der Marktpreis vollständig ausgeglichen.
Strategische Vorteile
- Der RSI-Indikator wird verwendet, um Überkaufe und Überverkäufe zu ermitteln, um zu verhindern, dass die Höhen und Tiefen verfolgt werden.
- Der Moving Average filtert Trends und reduziert die Abweichungen.
- Die Einführung von Schritt-zu-Schritt-Sperren maximiert die Gewinne.
- Ein höherer Stop-Loss-Punkt ist festgelegt, um dem Trend den richtigen Raum zu geben.
- In Kombination mit einer Trendwende-Strategie für die Umkehrung der Liquidation und einer schnellen Reaktion auf unerwartete Ereignisse.
Strategisches Risiko
- Probleme mit der Einstellung der RSI-Parameter, was zu einer schlechten Erkennung führte.
- Problem mit der Einstellung der Moving Average-Parameter, was zu einer schlechten Filterwirkung führte.
- Die Stop-Loss-Punkte sind zu locker und es besteht die Gefahr, dass sich die Verluste ausweiten.
- Das ist eine sehr schwierige Aufgabe, die sich nicht lösen lässt.
- Die Reverse-Liquidation-Strategie führt zu unnötigen Verlusten.
Die Parameter müssen mehrfach getestet und optimiert werden. Die Stop-Loss-Sperre sollte angemessen eingestellt und in bestimmten Bereichen gelockert werden. Die Parameter müssen je nach Marktschwankungen angepasst werden.
Optimierungsrichtung
Die Optimierung kann in folgenden Bereichen weiter vorangetrieben werden:
- Mehr Filterindikatoren, um die Signalgenauigkeit zu verbessern. Zum Beispiel die Erweiterung der Filter für die Transaktionsmenge.
- Anpassung der Stop-Loss-Strategie, Verfolgung der Höchst- und Tiefstpreise, Erreichung eines mobilen Stop-Losses.
- Die Anpassung des Teils des Stopps an den Tracking-Stop ermöglicht die Maximierung der Gewinne.
- Hinzu kommt eine Kombination von Parametern, wie z. B. Datenspeicherung, unterschiedliche Zeitspannen für verschiedene Sorten.
- Erhöhung der Kosten für die Inhaber von leeren Futures und dynamische Anpassung der Stop-Loss-Regelung.
Zusammenfassen
Die Strategie als Ganzes ist eine eher erfahrene und zuverlässige Trend-Tracking-Strategie. Der RSI wird verwendet, um Überkauf-Überverkauf zu bestimmen. Der Moving Average wird verwendet, um die Wellen zu bestätigen.
// © CRabbit
//@version=5

// Starting with $100 and using 10% of the account per trade
strategy("RSI Template", shorttitle="RSI", overlay=false, initial_capital=100, default_qty_value=10, default_qty_type=strategy.percent_of_equity)

// RSI Indicator
ma(source, length, type) =>
    switch type
        "SMA" => ta.sma(source, length)
        "Bollinger Bands" => ta.sma(source, length)
"EMA" => ta.ema(source, length)- 1