Bollinger Band Downward Crossover RSI Pullback Handelsstrategie
Überblick
Die Strategie nutzt die Bollinger Bands, um zu beurteilen, ob der Preis in eine Überkauf-Überverkaufszone eingestiegen ist, in Kombination mit der RSI, um zu beurteilen, ob es eine Chance auf eine Rückkehr gibt, indem er bei der Bildung von Überkaufzonen frei ist und bei einem Preisanstieg über die Bollinger Bands aufhört.
Strategieprinzip
Die Strategie basiert auf folgenden Prinzipien:
- Wenn der Schlusskurs über die Brin-Band auf die Strecke kommt, bedeutet dies, dass die Vermögenswerte in eine Überkaufszone eingestiegen sind und eine Chance auf eine Rückführung besteht.
- Der RSI ist ein guter Indikator für Überkauf- und Überverkaufszonen.
- Kurzfristige Positionen, wenn der Schlusskurs von der oberen Bahn abweicht
- Wenn der RSI von einer Überkaufzone zurückfällt oder einen Stop-Loss auslöst, wird der Stop-Loss platziert
Analyse der Stärken
Diese Strategie hat folgende Vorteile:
- Der Brin-Band kann überkaufte und überverkaufte Zonen bestimmen und die Erfolgsrate von Trades erhöhen.
- Der RSI-Indikator filtert die Chancen auf falsche Durchbrüche, um unnötige Verluste zu vermeiden.
- Hohe Gewinn- und Verlustquote, maximale Risikokontrolle
Risikoanalyse
Die Risiken dieser Strategie sind:
- Nach dem Durchbruch der Bahn, die weiter anstieg, führte zu einer weiteren Ausweitung der Verluste.
- RSI-Verlust weiter ausgeweitet, nicht rechtzeitig zurückgegangen
- Einseitige Positionen, keine Marktabschließung
Das Risiko kann durch folgende Maßnahmen verringert werden:
- Stellpunkte entsprechend an und stelle deine Verluste rechtzeitig ein.
- In Kombination mit anderen Indikatoren beurteilen RSI Rückschlagsignale
- In Kombination mit dem Gleichgewichtsindikator, um zu beurteilen, ob ein Abschwung erreicht wurde
Optimierungsrichtung
Diese Strategie kann optimiert werden durch:
- Optimierung der Brin-Band-Parameter für mehr Handelsarten
- Optimierung der RSI-Parameter zur Verbesserung der Indikatorwirkung
- Hinzufügen von anderen Indikatoren zur Beurteilung von Trendwendepunkten
- Mehrköpfige Transaktionslogik
- Die Strategie ist in Kombination mit einer Stop-Loss-Strategie und einer dynamischen Anpassung der Stop-Loss-Punkte.
Zusammenfassen
Die Strategie ist eine typische Schnell-Short-Line-Handelsstrategie für Überkaufszonen. Die Bollinger Band nutzt die Kauf- und Verkaufspunkte, die RSI-Filtersignale. Die Risikoniveaus werden durch vernünftige Stopps kontrolliert. Die Effektivität kann durch Parameteroptimierung, Kombination von Indikatoren, Erhöhung der Positionslogik usw. verbessert werden.
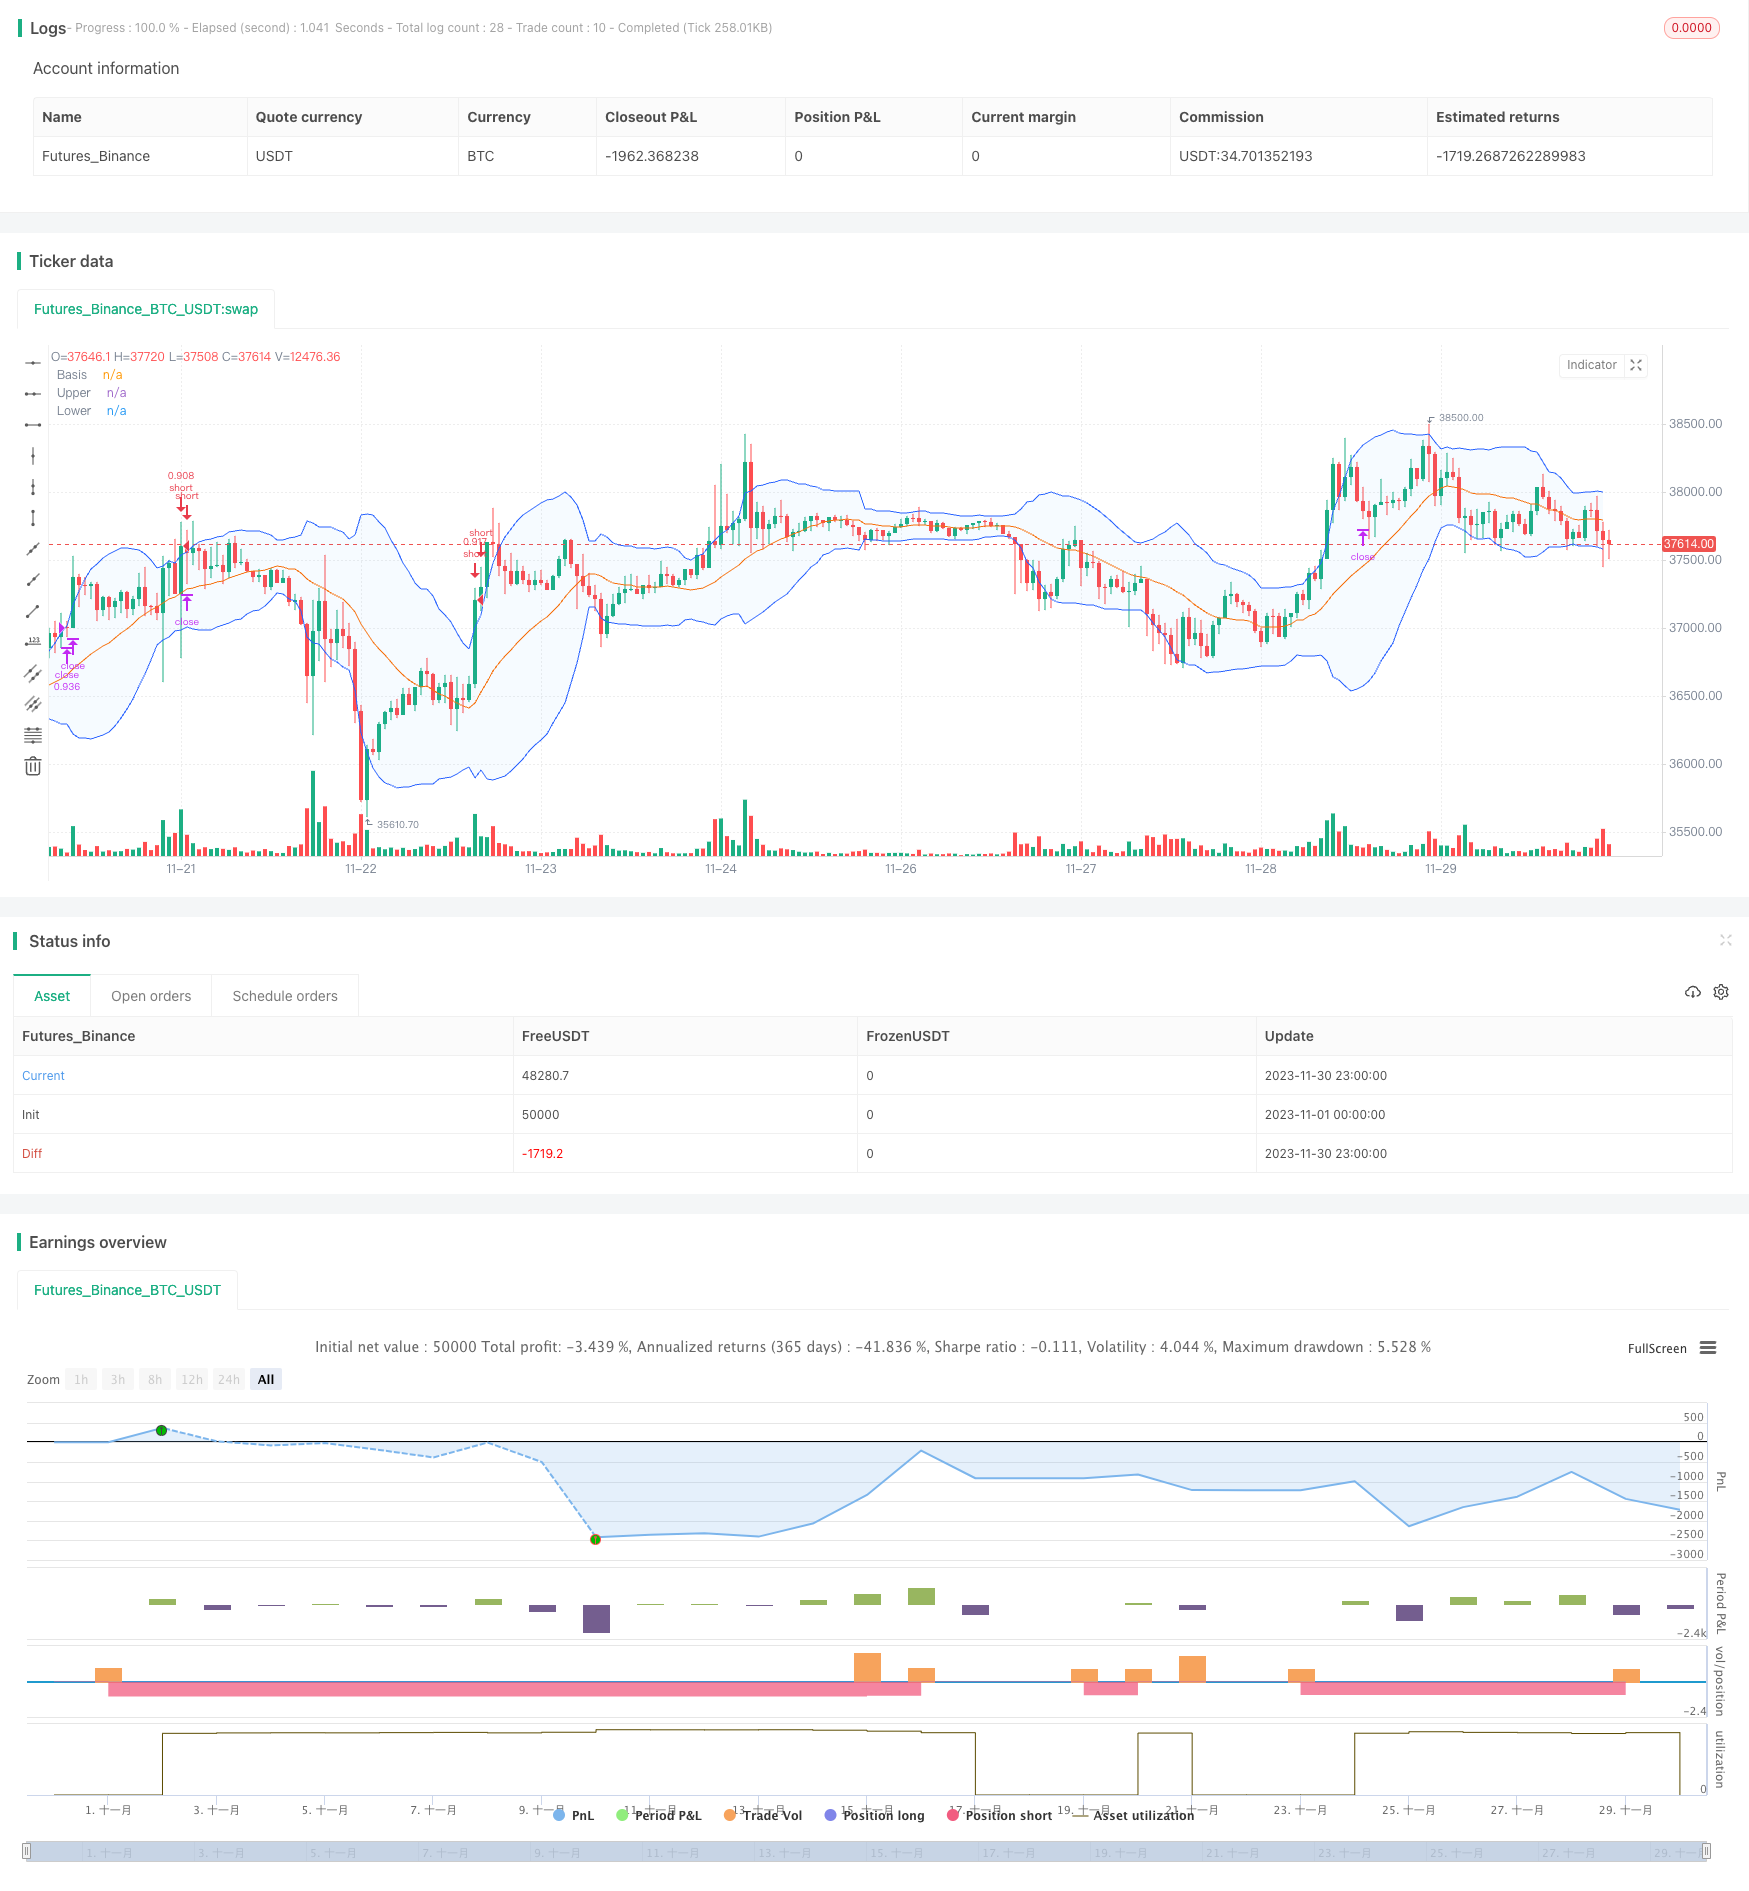
/*backtest
start: 2023-11-01 00:00:00
end: 2023-11-30 23:59:59
period: 1h
basePeriod: 15m
exchanges: [{"eid":"Futures_Binance","currency":"BTC_USDT"}]
*/

//@version=5
// This source code is subject to the terms of the Mozilla Public License 2.0 at https://mozilla.org/MPL/2.0/
// © Coinrule


strategy("Bollinger Band Below Price with RSI",
         overlay=true,
         initial_capital=1000,
         process_orders_on_close=true,
         default_qty_type=strategy.percent_of_equity,
         default_qty_value=70,
         commission_type=strategy.commission.percent,
         commission_value=0.1)

showDate = input(defval=true, title='Show Date Range')
timePeriod = time >= timestamp(syminfo.timezone, 2022, 1, 1, 0, 0)
notInTrade = strategy.position_size <= 0

//Bollinger Bands Indicator
length = input.int(20, minval=1)
src = input(close, title="Source")
mult = input.float(2.0, minval=0.001, maxval=50, title="StdDev")
basis = ta.sma(src, length)
dev = mult * ta.stdev(src, length)
upper = basis + dev
lower = basis - dev
offset = input.int(0, "Offset", minval = -500, maxval = 500)
plot(basis, "Basis", color=#FF6D00, offset = offset)
p1 = plot(upper, "Upper", color=#2962FF, offset = offset)
p2 = plot(lower, "Lower", color=#2962FF, offset = offset)
fill(p1, p2, title = "Background", color=color.rgb(33, 150, 243, 95))

// RSI inputs and calculations
lengthRSI = 14
RSI = ta.rsi(close, lengthRSI)


// Configure trail stop level with input options
longTrailPerc = input.float(title='Trail Long Loss (%)', minval=0.0, step=0.1, defval=3) * 0.01
shortTrailPerc = input.float(title='Trail Short Loss (%)', minval=0.0, step=0.1, defval=3) * 0.01

// Determine trail stop loss prices
//longStopPrice = 0.0
shortStopPrice = 0.0

//longStopPrice := if strategy.position_size > 0
    //stopValue = close * (1 - longTrailPerc)
    //math.max(stopValue, longStopPrice[1])
//else
    //0

shortStopPrice := if strategy.position_size < 0
    stopValue = close * (1 + shortTrailPerc)
    math.min(stopValue, shortStopPrice[1])
else
    999999


//Entry and Exit
strategy.entry(id="short", direction=strategy.short, when=ta.crossover(close, upper) and RSI < 70 and timePeriod and notInTrade)

if (ta.crossover(upper, close) and RSI > 70 and timePeriod)
    strategy.exit(id='close', limit = shortStopPrice)