Adaptive Handelsstrategie basierend auf dem ADX-Indikator
Überblick
Der Kern dieser Strategie ist die Verwendung von ADX-Indikatoren, um Markttrends zu beurteilen, und in Kombination mit DI+-Indikatoren Differenz automatisch identifizieren Durchbrüche, so dass die Anpassung des Handels zu erreichen. Wenn die DI+ und ADX Differenz über die eingestellte Schwelle zu tun mehr, wenn die DI-und ADX Differenz über die eingestellte Schwelle zu tun null.
Strategieprinzip
Berechnen Sie True Range, Directional Movement und andere Indikatoren wie DI+, DI- und DX.
Vergleiche die Differenzamplitude von DI+ und ADX mit 1, die Differenzamplitude von DI- mit ADX mit 2.
Wenn die Amplitude 1 größer ist als der eingestellte Schwellenwert (z. B. 10), wird ein Mehrfachsignal erzeugt. Wenn die Amplitude 2 größer ist als der eingestellte Schwellenwert (z. B. 10), wird ein Fehlsignal erzeugt.
Die ADX wird zwischen DI+ und DI- angefordert, um falsche Signale zu filtern.
Dies bedeutet, dass der DI+ oder der DI- deutlich vor dem ADX liegt, wenn der Markt in einen Trend eintritt, um ein Handelssignal zu erzeugen. Wenn der Markt am Ende eines Trends ist, nähern sich die DI+, DI- und ADX wieder zusammen und vermeiden es, die Höhen und Tiefen zu verfolgen.
Strategische Vorteile
Es ist eine automatische Identifizierung von Trendbrechpunkten, ohne dass ein menschliches Urteilsvermögen erforderlich ist.
Die Differenz zwischen DI und ADX kann flexibel angepasst werden, um den unterschiedlichen Marktbedingungen gerecht zu werden.
In Kombination mit dem ADX-Kennzeichen können Fehlsignale wirksam gefiltert werden.
Die Aktien halten sich länger, es wird nicht häufig gehandelt, und die Kapitalnutzung ist hoch.
Der Rückzug ist kontrollierbar, das Wachstum stabil.
Strategisches Risiko
Die ADX-Indikatoren sind nachlässig und können kurzfristige Handelsmöglichkeiten verpassen. Die ADX-Parameter können in Kombination mit anderen Indikatoren oder reduziert werden, um die Empfindlichkeit zu erhöhen.
Es kann eine Stop-Loss-Strategie eingeführt oder ADX-Filterbedingungen hinzugefügt werden, um die Wahrscheinlichkeit von Schwankungen zu verringern.
Bei starken Trendwechseln ist die Verlustgefahr hoch. Um das Risiko zu kontrollieren, können Sie einen mobilen Stop oder einen Tracking-Stop einrichten.
Strategieoptimierung
Es ist möglich, verschiedene Märkte und Sorten zu testen und die optimale Kombination von Parametern anzupassen.
Es kann in Kombination mit anderen Indikatoren in Betracht gezogen werden, um die Signalgenauigkeit zu verbessern. Zum Beispiel MACD, KD usw.
Erhöhung der Stop-Loss-Strategie zur Kontrolle des Rückzugs und Maximierung der Verluste.
Einführung von Positionsverwaltung, um die Handelspositionen an die Marktlage anzupassen.
Optimierung der Auswahl der Eintritts- und Ausstiegspunkte zur Verringerung des Handelsrisikos.
Zusammenfassen
Diese Strategie integriert die Vorteile der ADX- und DI-Indikatoren und ermöglicht eine effektive Beurteilung der Trends und die Anpassung des Handels. Es besteht keine Notwendigkeit, häufig zu manipulieren und ist für die mittlere und lange Linie geeignet.
/*backtest
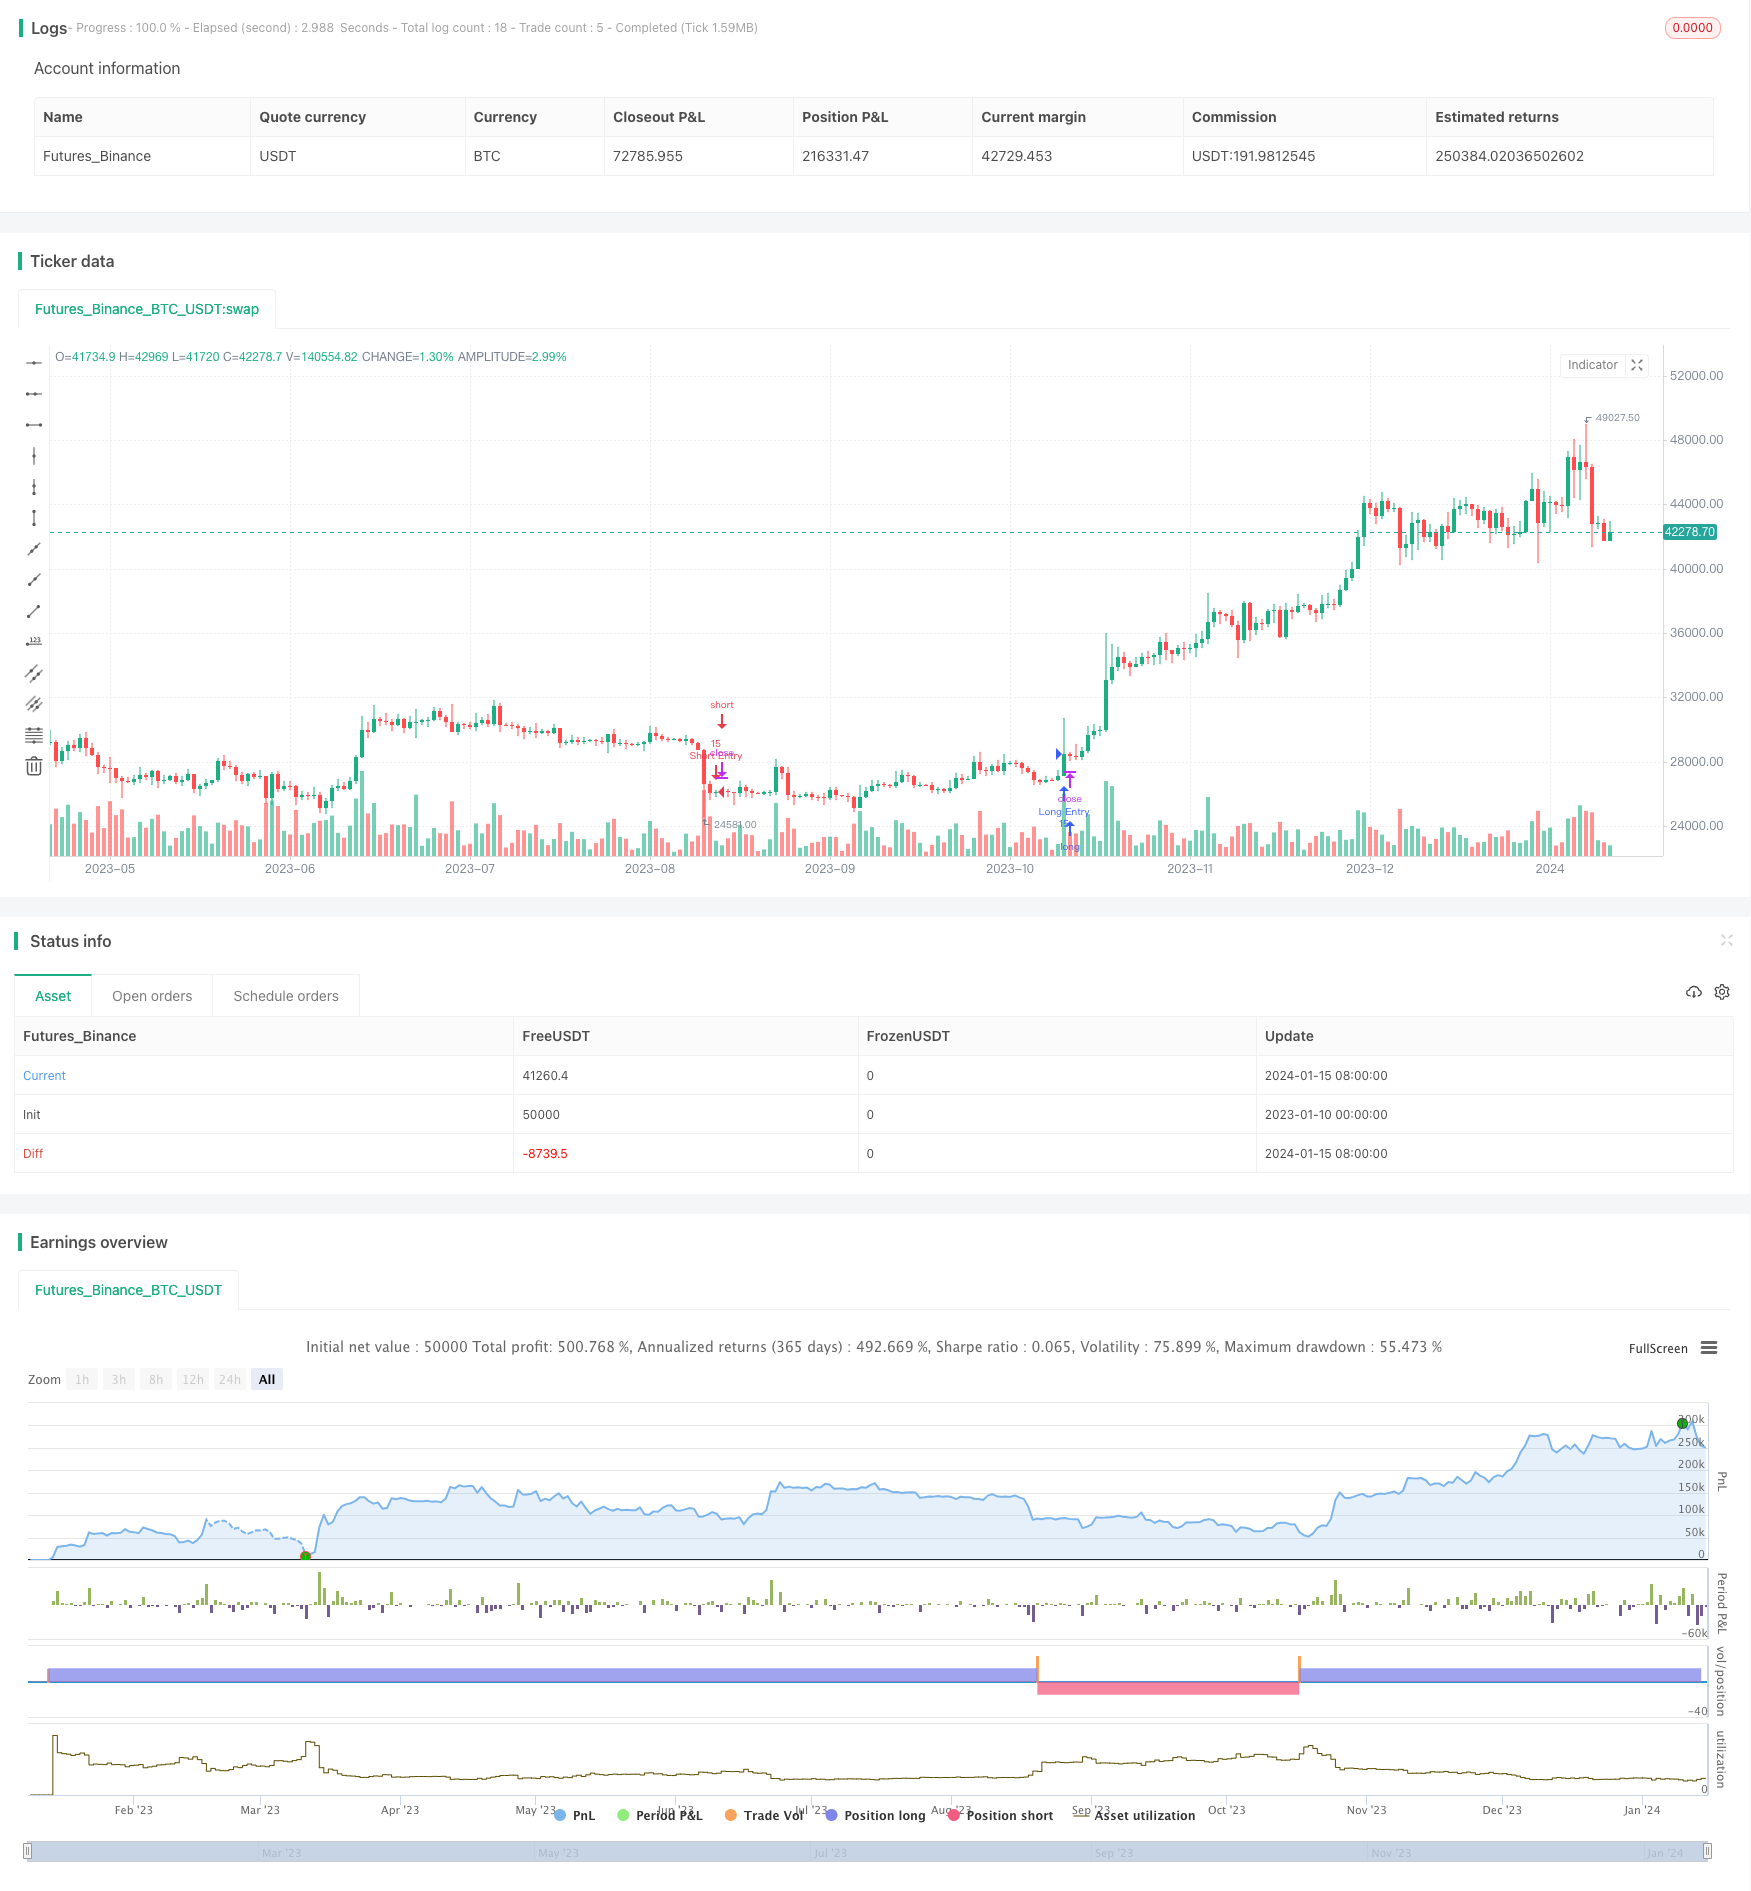
start: 2023-01-10 00:00:00
end: 2024-01-16 00:00:00
period: 1d
basePeriod: 1h
exchanges: [{"eid":"Futures_Binance","currency":"BTC_USDT"}]
*/
// This source code is subject to the terms of the Mozilla Public License 2.0 at https://mozilla.org/MPL/2.0/
// © MAURYA_ALGO_TRADER
//@version=5
strategy("Monthly Performance by Dr. Maurya", overlay=true, default_qty_value = 15, commission_type = strategy.commission.percent, commission_value = 0.1)
len = input(14)
th = input(20)
TrueRange = math.max(math.max(high - low, math.abs(high - nz(close[1]))), math.abs(low - nz(close[1])))
DirectionalMovementPlus = high - nz(high[1]) > nz(low[1]) - low ? math.max(high - nz(high[1]), 0) : 0
DirectionalMovementMinus = nz(low[1]) - low > high - nz(high[1]) ? math.max(nz(low[1]) - low, 0) : 0
SmoothedTrueRange = 0.0
SmoothedTrueRange := nz(SmoothedTrueRange[1]) - nz(SmoothedTrueRange[1]) / len + TrueRange
SmoothedDirectionalMovementPlus = 0.0
SmoothedDirectionalMovementPlus := nz(SmoothedDirectionalMovementPlus[1]) - nz(SmoothedDirectionalMovementPlus[1]) / len + DirectionalMovementPlus
SmoothedDirectionalMovementMinus = 0.0
SmoothedDirectionalMovementMinus := nz(SmoothedDirectionalMovementMinus[1]) - nz(SmoothedDirectionalMovementMinus[1]) / len + DirectionalMovementMinus
DIPlus = SmoothedDirectionalMovementPlus / SmoothedTrueRange * 100
DIMinus = SmoothedDirectionalMovementMinus / SmoothedTrueRange * 100
DX = math.abs(DIPlus - DIMinus) / (DIPlus + DIMinus) * 100
ADX = ta.sma(DX, len)
//diff_1 = math.abs(DIPlus - DIMinus)
diff_2 = math.abs(DIPlus-ADX)
diff_3 = math.abs(DIMinus - ADX)
long_diff = input(10, "Long Difference")
short_diff = input(10, "Short Difference")
buy_condition = diff_2 >=long_diff and diff_3 >=long_diff and (ADX < DIPlus and ADX > DIMinus)
sell_condition = diff_2 >=short_diff and diff_3 >=short_diff and (ADX > DIPlus and ADX < DIMinus)
if buy_condition
strategy.entry("Long Entry", strategy.long, comment = "Long")
if sell_condition
strategy.entry("Short Entry", strategy.short, comment = "Short")
// Copy below code to end of the desired strategy script
///////////////////////////////////////////////////////////////////////////////////////////////////////////////////////
// monthly pnl performance by Dr. Maurya @MAURYA_ALGO_TRADER //
///////////////////////////////////////////////////////////////////////////////////////////////////////////////////////
show_performance = input.bool(true, 'Show Monthly Monthly Performance ?', group='Monthly Performance')
dash_loc_mp = input("Bottom Right","Location" ,options=["Top Right","Bottom Right","Top Left","Bottom Left", "Middle Right","Bottom Center"] ,group='Monthly Performance', inline = "performance")
text_size_mp = input('Small',"Size" ,options=["Tiny","Small","Normal","Large"] ,group='Monthly Performance', inline = "performance")
bg_c = input.color( color.rgb(7, 226, 242, 38), "Background Color", group='Monthly Performance')
text_head_color = input.color( color.rgb(0,0,0), "Month/Year Heading Color", group='Monthly Performance')
tab_month_c = input.color( color.white, "Month PnL Data Color", group='Monthly Performance')
tab_year_c = input.color( color.rgb(0,0,0), "Year PnL Data Color", group='Monthly Performance')
border_c = input.color( color.white, "Table Border Color", group='Monthly Performance')
var table_position_mp = dash_loc_mp == 'Top Left' ? position.top_left :
dash_loc_mp == 'Bottom Left' ? position.bottom_left :
dash_loc_mp == 'Middle Right' ? position.middle_right :
dash_loc_mp == 'Bottom Center' ? position.bottom_center :
dash_loc_mp == 'Top Right' ? position.top_right : position.bottom_right
var table_text_size_mp = text_size_mp == 'Tiny' ? size.tiny :
text_size_mp == 'Small' ? size.small :
text_size_mp == 'Normal' ? size.normal : size.large
/////////////////
strategy.initial_capital =50000
/////////////////////////////////////////////
// var bool new_month = na
new_month = ta.change(month) //> 0 ? true : false
newest_month = new_month and strategy.closedtrades >= 1
// profit
only_profit = strategy.netprofit
initial_balance = strategy.initial_capital
// month number
var int month_number = na
month_number := (ta.valuewhen(newest_month, month(time), 0)) //and month(time) > 1 ? (ta.valuewhen(newest_month, month(time), 0) - 1) : 12 //1 to 12
//month_year
var int month_time = na
month_time := ta.valuewhen(newest_month, time, 0) - 2419200000
var int m_counter = 0
if newest_month
m_counter += 1
// current month values
var bool new_year = na
new_year := ta.change(year)
curr_m_pnl = only_profit - nz(ta.valuewhen(newest_month, only_profit, 0), 0)
curr_m_number = newest_month ? ta.valuewhen(newest_month, month(time), 0) : month(time)
curr_y_pnl = (only_profit - nz(ta.valuewhen(new_year, only_profit, 0),0))
var float [] net_profit_array = array.new_float()
var int [] month_array = array.new_int()
var int [] month_time_array = array.new_int()
if newest_month
array.push(net_profit_array, only_profit)
array.push(month_array, month_number)
array.push(month_time_array, month_time)
var float [] y_pnl_array = array.new_float()
var int [] y_number_array = array.new_int()
var int [] y_time_array = array.new_int()
newest_year = ta.change(year) and strategy.closedtrades >= 1
get_yearly_pnl = nz(ta.valuewhen(newest_year, strategy.netprofit, 0) - nz(ta.valuewhen(newest_year, strategy.netprofit, 1), 0), 0)
get_m_year = ta.valuewhen(newest_year, year(time), 1)
get_y_time = ta.valuewhen(newest_year, time, 0)
if newest_year
array.push(y_pnl_array, get_yearly_pnl)
array.push(y_number_array, get_m_year)
array.push(y_time_array, get_y_time)
var float monthly_profit = na
var int column_month_number = na
var int row_month_time = na
var testTable = table.new(position = table_position_mp, columns = 14, rows = 40, bgcolor = bg_c, border_color = border_c, border_width = 1)
if barstate.islastconfirmedhistory and show_performance
table.cell(table_id = testTable, column = 0, row = 0, text = "YEAR", text_color = text_head_color, text_size=table_text_size_mp)
table.cell(table_id = testTable, column = 1, row = 0, text = "JAN", text_color = text_head_color, text_size=table_text_size_mp)
table.cell(table_id = testTable, column = 2, row = 0, text = "FEB", text_color = text_head_color, text_size=table_text_size_mp)
table.cell(table_id = testTable, column = 3, row = 0, text = "MAR", text_color = text_head_color, text_size=table_text_size_mp)
table.cell(table_id = testTable, column = 4, row = 0, text = "APR", text_color = text_head_color, text_size=table_text_size_mp)
table.cell(table_id = testTable, column = 5, row = 0, text = "MAY", text_color = text_head_color, text_size=table_text_size_mp)
table.cell(table_id = testTable, column = 6, row = 0, text = "JUN", text_color = text_head_color, text_size=table_text_size_mp)
table.cell(table_id = testTable, column = 7, row = 0, text = "JUL", text_color = text_head_color, text_size=table_text_size_mp)
table.cell(table_id = testTable, column = 8, row = 0, text = "AUG", text_color = text_head_color, text_size=table_text_size_mp)
table.cell(table_id = testTable, column = 9, row = 0, text = "SEP", text_color = text_head_color, text_size=table_text_size_mp)
table.cell(table_id = testTable, column = 10, row = 0, text = "OCT", text_color = text_head_color, text_size=table_text_size_mp)
table.cell(table_id = testTable, column = 11, row = 0, text = "NOV", text_color = text_head_color, text_size=table_text_size_mp)
table.cell(table_id = testTable, column = 12, row = 0, text = "DEC", text_color =text_head_color, text_size=table_text_size_mp)
table.cell(table_id = testTable, column = 13, row = 0, text = "YEAR P/L", text_color = text_head_color, text_size=table_text_size_mp)
for i = 0 to (array.size(y_number_array) == 0 ? na : array.size(y_number_array) - 1)
row_y = year(array.get(y_time_array, i)) - year(array.get(y_time_array, 0)) + 1
table.cell(table_id = testTable, column = 13, row = row_y, text = str.tostring(array.get(y_pnl_array , i), "##.##") + '\n' + '(' + str.tostring(array.get(y_pnl_array , i)*100/initial_balance, "##.##") + ' %)', bgcolor = array.get(y_pnl_array , i) > 0 ? color.green : array.get(y_pnl_array , i) < 0 ? color.red : color.gray, text_color = tab_year_c, text_size=table_text_size_mp)
curr_row_y = array.size(month_time_array) == 0 ? 1 : (year(array.get(month_time_array, array.size(month_time_array) - 1))) - (year(array.get(month_time_array, 0))) + 1
table.cell(table_id = testTable, column = 13, row = curr_row_y, text = str.tostring(curr_y_pnl, "##.##") + '\n' + '(' + str.tostring(curr_y_pnl*100/initial_balance, "##.##") + ' %)', bgcolor = curr_y_pnl > 0 ? color.green : curr_y_pnl < 0 ? color.red : color.gray, text_color = tab_year_c, text_size=table_text_size_mp)
for i = 0 to (array.size(net_profit_array) == 0 ? na : array.size(net_profit_array) - 1)
monthly_profit := i > 0 ? ( array.get(net_profit_array, i) - array.get(net_profit_array, i - 1) ) : array.get(net_profit_array, i)
column_month_number := month(array.get(month_time_array, i))
row_month_time :=((year(array.get(month_time_array, i))) - year(array.get(month_time_array, 0)) ) + 1
table.cell(table_id = testTable, column = column_month_number, row = row_month_time, text = str.tostring(monthly_profit, "##.##") + '\n' + '(' + str.tostring(monthly_profit*100/initial_balance, "##.##") + ' %)', bgcolor = monthly_profit > 0 ? color.green : monthly_profit < 0 ? color.red : color.gray, text_color = tab_month_c, text_size=table_text_size_mp)
table.cell(table_id = testTable, column = 0, row =row_month_time, text = str.tostring(year(array.get(month_time_array, i)), "##.##"), text_color = text_head_color, text_size=table_text_size_mp)
curr_row_m = array.size(month_time_array) == 0 ? 1 : (year(array.get(month_time_array, array.size(month_time_array) - 1))) - (year(array.get(month_time_array, 0))) + 1
table.cell(table_id = testTable, column = curr_m_number, row = curr_row_m, text = str.tostring(curr_m_pnl, "##.##") + '\n' + '(' + str.tostring(curr_m_pnl*100/initial_balance, "##.##") + ' %)', bgcolor = curr_m_pnl > 0 ? color.green : curr_m_pnl < 0 ? color.red : color.gray, text_color = tab_month_c, text_size=table_text_size_mp)
table.cell(table_id = testTable, column = 0, row =curr_row_m, text = str.tostring(year(time), "##.##"), text_color = text_head_color, text_size=table_text_size_mp)
//============================================================================================================================================================================