Doppelter gleitender Durchschnittspreiskanal – Trendfolgestrategie
Überblick
Die Strategie basiert auf der Erstellung von Preiskanälen auf der Basis von Doppel-Gleichgewichten, wobei die Kanalbreite verwendet wird, um die Richtung der Preisentwicklung zu bestimmen, und eine Trendverfolgungsstrategie mit Stop-Loss-Tracking eingerichtet wird, um die Gewinne zu verfolgen.
Strategieprinzip
Bei der Dual-Even-Line-Price-Channel-Strategie werden die Preiskanäle mit einem schnellen EMA und einem langsamen EMA aufgebaut. Das schnelle EMA hat 89 und das langsame EMA 200 Zyklen. Gleichzeitig werden die Preiskanalbereiche mit drei Mittellinien aufgebaut, basierend auf dem hohen, niedrigen und dem Schlusspreis.
Wenn ein schneller EMA oberhalb eines langsameren EMA liegt und der Preis unterhalb des Weges ist, wird er als Aufwärtstrend beurteilt. Wenn ein schneller EMA unterhalb eines langsameren EMA liegt und der Preis über dem Weg ist, wird er als Abwärtstrend beurteilt.
In einem Aufwärtstrend macht die Strategie kurz, um eine Trendwende zu bestimmen; in einem Abwärtstrend macht die Strategie mehr, um eine Trendwende zu bestimmen.
Die Strategie bietet außerdem eine Stop-Loss-Tracking-Funktion. Nach der Einnahme der Position wird der Stop-Loss-Preis in Echtzeit aktualisiert, um die Gewinne zu sperren.
Analyse der Stärken
Der größte Vorteil dieser Strategie besteht darin, dass die Preisentwicklung durch die Verwendung einer doppelten Gleichgewichtseinstellung ermittelt wird, die in Kombination mit einer Umkehrungsposition vermieden wird. Die mobile Stop-Loss-Funktion ermöglicht es, Gewinne zu sichern und das Risiko von Verlusten zu verringern.
Weitere Vorteile sind: großer Raum für die Optimierung der Parameter, Parameter können für verschiedene Sorten und Perioden angepasst werden; Echtzeit-Aktualisierung des Stop-Loss-Preises, geringes Betriebsrisiko.
Risikoanalyse
Das Hauptrisiko dieser Strategie besteht darin, dass die Wirkung der Umkehrsignale schlecht beurteilt wird, was zu Fehleinschätzungen führen kann. In diesem Fall müssen die Parameter optimiert werden, um sicherzustellen, dass die Wirkung der Trendumkehr festgestellt wird.
Darüber hinaus ist die Einstellung des Stop-Loss-Punkts von entscheidender Bedeutung. Ein zu großer Stop-Loss kann zu unentschlossenen Stop-Losses führen; ein zu kleiner Stop-Loss kann zu übermäßigen Stop-Losses führen. Dies muss je nach Sorte angepasst werden.
Schließlich können Datenprobleme auch dazu führen, dass die Strategie fehlschlägt. Es ist sicherzustellen, dass zuverlässige, kontinuierliche und ausreichende historische Daten zur Rückverfolgung und Überprüfung der Strategie verwendet werden.
Optimierungsrichtung
Die Optimierung der Strategie konzentriert sich auf folgende Bereiche:
Die Perioden der schnellen EMA und der langsamen EMA können optimiert werden, wobei verschiedene Kombinationen von Parametern verwendet werden, um die Wirkung zu beurteilen
Die Auf- und Abwärtsparameter des Preiskanals können ebenfalls angepasst werden, um nach passenderen Periodiparametern zu suchen
Die Einstellung des Stop-Loss-Punktes ist entscheidend, um verschiedene Parameter zu testen, um die Stop-Loss-Strategie zu optimieren
Tests, die zeigen, ob andere Indikatoren eingeführt wurden, um eine Trendwende zu erkennen und die Effektivität zu verbessern
Zusammenfassen
Die Strategie arbeitet in einem flüssigen Gesamtbetrieb und nutzt die doppelte Gleichgewichtskanal, um die Trendrichtung zu bestimmen, und ist eine eher stabile Trendverfolgungsstrategie mit einem beweglichen Stop-Loss, um die Gewinne zu sperren. Durch die Optimierung der Parameter und der Optimierung der Windkontroll-Einstellungen kann die Strategie zu einer der effizienten Quantifizierungsstrategien werden.
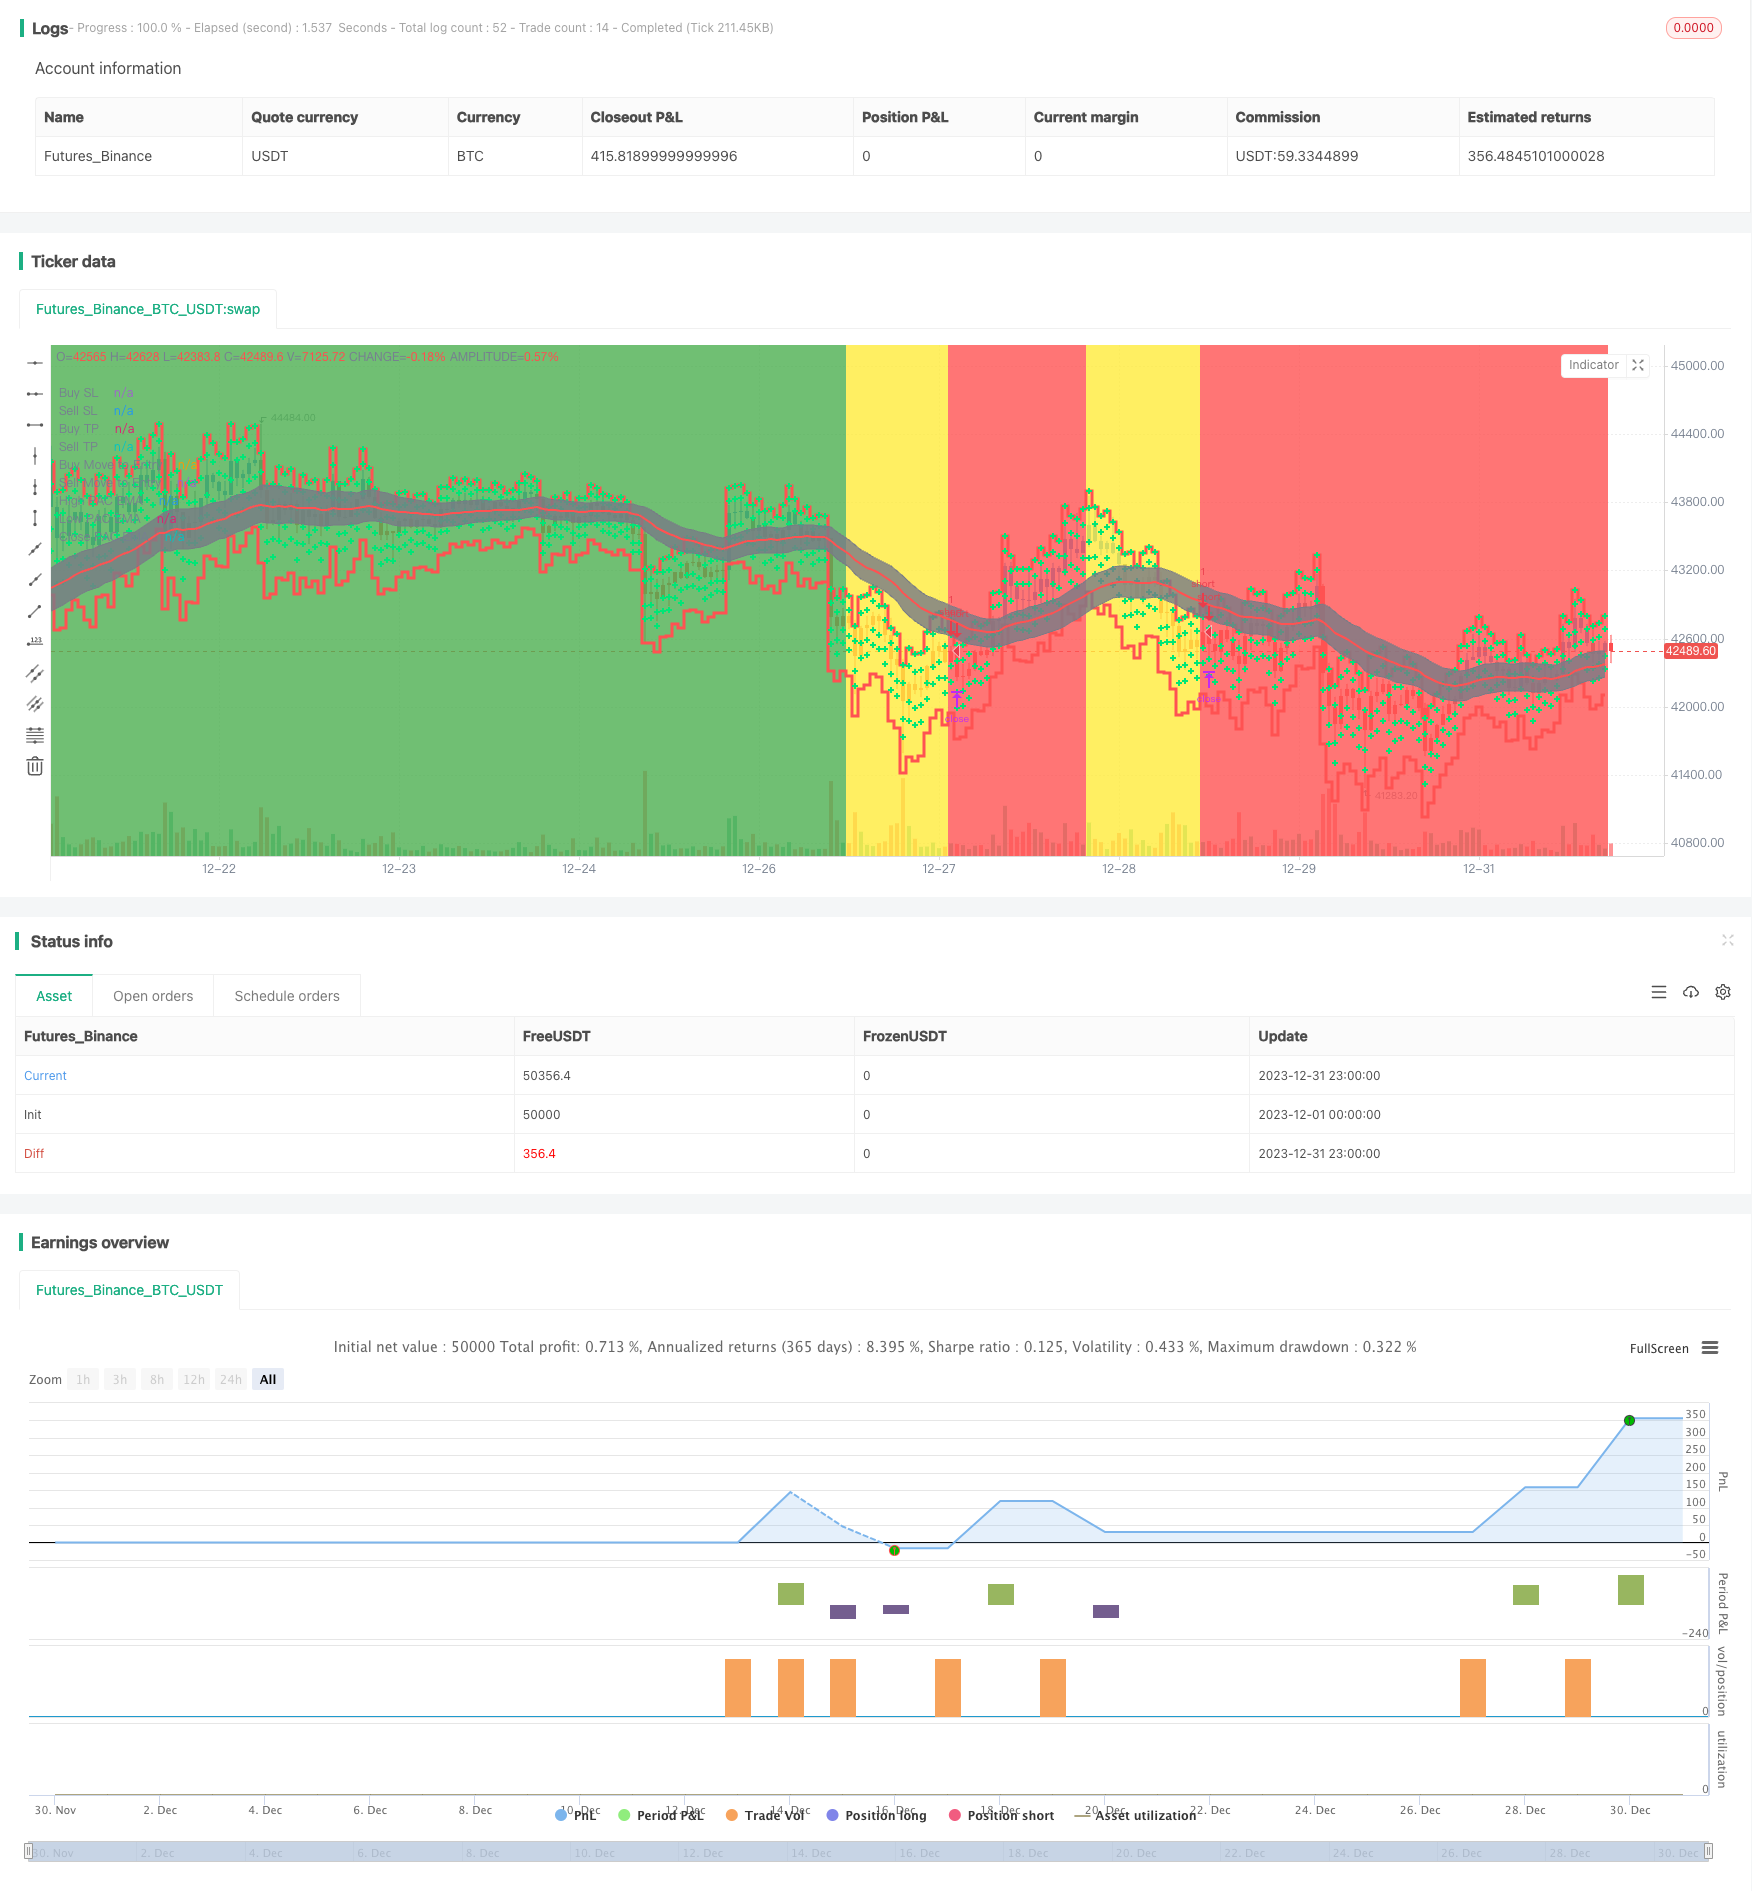
/*backtest
start: 2023-12-01 00:00:00
end: 2023-12-31 23:59:59
period: 1h
basePeriod: 15m
exchanges: [{"eid":"Futures_Binance","currency":"BTC_USDT"}]
*/

//@version=4
strategy("Trend trader Strategy", overlay=true)

//f you want to trade shallower Pullbacks for quicker scalps, try reducing the
//    PAC and EMA combination lengths for example:
//      * 21 PAC and 55, 144, 377 for fast, medium, slow EMAs
//      * 13 PAC and 34, 89, 233 for fast, medium, slow EMAs
//  - Each alert should be evaluated on it's own merits, the alerts are designed to highlight possible
//    scalping trades from Pullback recoveries around the PAC.

fromDay = input(defval = 1, title = "From Day", minval = 1, maxval = 31)
fromMonth = input(defval = 6, title = "From Month", minval = 1, maxval = 12)
fromYear = input(defval = 2020, title = "From Year", minval = 1970)

// To Date Inputs
toDay = input(defval = 1, title = "To Day", minval = 1, maxval = 31)
toMonth = input(defval = 12, title = "To Month", minval = 1, maxval = 12)
toYear = input(defval = 2020, title = "To Year", minval = 1970)

isMon() => dayofweek(time('D')) == dayofweek.monday
isTue() => dayofweek(time('D')) == dayofweek.tuesday
isWed() => dayofweek(time('D')) == dayofweek.wednesday
isThu() => dayofweek(time('D')) == dayofweek.thursday
isFri() => dayofweek(time('D')) == dayofweek.friday

// Calculate start/end date and time condition
DST = 1 //day light saving for usa
//--- Europe
London = iff(DST==0,"0000-0900","0100-1000")
//--- America
NewYork = iff(DST==0,"0400-1400","0500-1500")
//--- Pacific
Sydney = iff(DST==0,"1300-2200","1400-2300")
//--- Asia
Tokyo = iff(DST==0,"1500-2400","1600-0100")

customTime =iff(DST==0,"2300-1500","2400-1600")
customTime2 =iff(DST==0,"0800-1500","0900-1600")

//-- Time In Range
timeinrange(res, sess) => time(res, sess) != 0

london = timeinrange(timeframe.period, London)
newyork = timeinrange(timeframe.period, NewYork)
c_time = timeinrange(timeframe.period,customTime)
c_time2 = timeinrange(timeframe.period,customTime2)

startDate = timestamp(fromYear, fromMonth, fromDay, 00, 00)
finishDate = timestamp(toYear, toMonth, toDay, 00, 00)
time_cond = time >= startDate and time <= finishDate and (london or newyork)


    // === INPUTS ===
HiLoLen         = input(34, minval=2, title="High Low PAC channel Length")
fastEMAlength   = input(89, minval=2)
mediumEMAlength = input(200, minval=2)
slowEMAlength   = input(600, minval=2)
ShowFastEMA     = input(false)
ShowMediumEMA   = input(false)
ShowSlowEMA     = input(false)
ShowHHLL        = input(false)
ShowFractals    = input(false)
filterBW        = input(false, title="Show Ideal Fractals Only")
ShowBarColor    = input(true, title="Show coloured Bars around PAC")
ShowBuySell     = input(false, title="Show Buy/Sell Alert Arrows")
Lookback        = input(3, minval=1, title="Pullback Lookback for PAC Cross Check")
DelayArrow      = input(false, title="Show Alert Arrows Only on Closed Candles")
Delay           = DelayArrow ? 1 : 0
ShowTrendBGcolor= input(true)
UseHAcandles    = input(false, title="Use Heikin Ashi Candles in Algo Calculations")
//
// === /INPUTS ===

// === BASE FUNCTIONS ===

haClose = UseHAcandles ? security(heikinashi(syminfo.tickerid), timeframe.period, close) : close
haOpen  = UseHAcandles ? security(heikinashi(syminfo.tickerid), timeframe.period, open) : open
haHigh  = UseHAcandles ? security(heikinashi(syminfo.tickerid), timeframe.period, high) : high
haLow   = UseHAcandles ? security(heikinashi(syminfo.tickerid), timeframe.period, low) : low


//  ||---   Fractal Recognition Functions:  ---------------------------------------------------------------||
isRegularFractal(mode) =>
    ret = mode == 1 ? high[4] < high[3] and high[3] < high[2] and high[2] > high[1] and
       high[1] > high[0] : mode == -1 ?
       low[4] > low[3] and low[3] > low[2] and low[2] < low[1] and low[1] < low[0] :
       false
    ret

isBWFractal(mode) =>
    ret = mode == 1 ? high[4] < high[2] and high[3] <= high[2] and high[2] >= high[1] and
       high[2] > high[0] : mode == -1 ?
       low[4] > low[2] and low[3] >= low[2] and low[2] <= low[1] and low[2] < low[0] :
       false
    ret
//  ||-----------------------------------------------------------------------------------------------------||

//
// === /BASE FUNCTIONS ===

// === SERIES SETUP ===
//

//  ||---   Setup Moving Averages and PAC channel:
//  ||-----------------------------------------------------------------------------------------------------||
fastEMA     = ema(haClose, fastEMAlength)
mediumEMA   = ema(haClose, mediumEMAlength)
slowEMA     = ema(haClose, slowEMAlength)
pacC        = ema(haClose, HiLoLen)
pacL        = ema(haLow, HiLoLen)
pacU        = ema(haHigh, HiLoLen)
TrendDirection = fastEMA > mediumEMA and pacL > mediumEMA ? 1 :
   fastEMA < mediumEMA and pacU < mediumEMA ? -1 : 0

//  ||---   Fractal Recognition:
//  ||-----------------------------------------------------------------------------------------------------||
filteredtopf = filterBW ? isRegularFractal(1) : isBWFractal(1)
filteredbotf = filterBW ? isRegularFractal(-1) : isBWFractal(-1)
//  ||-----------------------------------------------------------------------------------------------------||
//  ||---   Higher Highs, Lower Highs, Higher Lows, Lower Lows  -------------------------------------------||
valuewhen_H0 = valuewhen(filteredtopf == true, high[2], 0)
valuewhen_H1 = valuewhen(filteredtopf == true, high[2], 1)
valuewhen_H2 = valuewhen(filteredtopf == true, high[2], 2)
//
higherhigh = filteredtopf == false ? false :
   valuewhen_H1 < valuewhen_H0 and valuewhen_H2 < valuewhen_H0
lowerhigh = filteredtopf == false ? false :
   valuewhen_H1 > valuewhen_H0 and valuewhen_H2 > valuewhen_H0
valuewhen_L0 = valuewhen(filteredbotf == true, low[2], 0)
valuewhen_L1 = valuewhen(filteredbotf == true, low[2], 1)
valuewhen_L2 = valuewhen(filteredbotf == true, low[2], 2)
//
higherlow = filteredbotf == false ? false :
   valuewhen_L1 < valuewhen_L0 and valuewhen_L2 < valuewhen_L0
lowerlow = filteredbotf == false ? false :
   valuewhen_L1 > valuewhen_L0 and valuewhen_L2 > valuewhen_L0

//
// === /SERIES ===

//
// === PLOTTING ===
//
// Plot the Price Action Channel (PAC) base on EMA high,low and close
L = plot(pacL, color=color.gray, linewidth=1, title="High PAC EMA", transp=50)
U = plot(pacU, color=color.gray, linewidth=1, title="Low PAC EMA", transp=50)
C = plot(pacC, color=color.red, linewidth=2, title="Close PAC EMA", transp=0)
fill(L, U, color=color.gray, transp=90, title="Fill HiLo PAC")

// Colour bars according to the close position relative to the PAC selected.
BARcolor = haClose > pacU ? color.blue : haClose < pacL ? color.red : color.gray
barcolor(ShowBarColor ? BARcolor : na, title="Bar Colours")
//
BGcolor = TrendDirection == 1 ? color.green :
   TrendDirection == -1 ? color.red : color.yellow
bgcolor(ShowTrendBGcolor ? BGcolor : na, transp=90, title="Trend BG Color")


// STEP 1:
// Configure trail stop level with input options (optional)
longTrailPerc = input(title="Trail Long Loss (%)",
     type=input.float, minval=0.0, step=0.05, defval=0.1) * 0.01

shortTrailPerc = input(title="Trail Short Loss (%)",
     type=input.float, minval=0.0, step=0.05, defval=0.1) * 0.01


atrRange = input(14, title="ATR Range", type=input.integer)
buyStop = input(2, title="* ATR Buy SL", type=input.float)
sellStop = input(1, title="* ATR Sell SL", type=input.float)
targetATR = input(1, title="* ATR TP1", type=input.float)
moveToEntryFigure = input(0.5, title=" move to entry in % towards target", type=input.float)

showMove = input(true, title="Show Move to Entry points")

showMoveBuycol = showMove ? color.lime : na
showMoveSellcol = showMove ? color.lime : na

// Plots

buyStopp = plot(close - atr(atrRange) * buyStop, title="Buy SL", style=plot.style_stepline, color=color.red, transp=75, linewidth=3)
sellStopp = plot(close + atr(atrRange) * sellStop, title="Sell SL", style=plot.style_stepline, color=color.red, transp=75, linewidth=3)

buyTP1 = plot(close + atr(atrRange) * targetATR, title="Buy TP", style=plot.style_cross, color=color.lime, transp=75, linewidth=3)
sellTP1 = plot(close - atr(atrRange) * targetATR, title="Sell TP", style=plot.style_cross, color=color.lime, transp=75, linewidth=3)

buyMove = plot(close + atr(atrRange) * targetATR * moveToEntryFigure, title="Buy Move to Entry", style=plot.style_cross, color=showMoveBuycol, transp=75, linewidth=3)
sellMove = plot(close - atr(atrRange) * targetATR * moveToEntryFigure, title="Sell Move to Entry", style=plot.style_cross, color=showMoveSellcol, transp=75, linewidth=3)


if barstate.isconfirmed
    if(BGcolor==color.red and BGcolor[1]==color.yellow and c_time )
        strategy.entry("short", strategy.short, comment="short", alert_message='short')
        strategy.cancel("long")
    if(BGcolor==color.green and BGcolor[1]==color.yellow and c_time )
        strategy.entry("long", strategy.long, comment="long", alert_message = 'long')
        strategy.cancel("short")


// STEP 2:
// Determine trail stop loss prices
longStopPrice = 0.0, shortStopPrice = 0.0

longStopPrice := if (strategy.position_size > 0)
    stopValue = close * (1 - longTrailPerc)
    max(stopValue, longStopPrice[1])
else
    0

shortStopPrice := if (strategy.position_size < 0)
    stopValue = close * (1 + shortTrailPerc)
    min(stopValue, shortStopPrice[1])
else
    999999

// Plot stop loss values for confirmation
plot(series=(strategy.position_size > 0) ? longStopPrice : na,
     color=color.fuchsia, style=plot.style_cross,
     linewidth=2, title="Long Trail Stop")
plot(series=(strategy.position_size < 0) ? shortStopPrice : na,
     color=color.fuchsia, style=plot.style_cross,
     linewidth=2, title="Short Trail Stop")


// STEP 3:
// Submit exit orders for trail stop loss price
//if (strategy.position_size > 0)
//    strategy.exit("XL TRL STP","long", stop=longStopPrice)

//if (strategy.position_size < 0)
//    strategy.exit("XS TRL STP","short", stop=shortStopPrice)


tp=input(0.0032,type=input.float, title="tp")
sl=input(0.001,type=input.float, title="sl")

//strategy.close("long", when= tp/2,qty_percent = 50)

//strategy.exit("longtp/sl","long",profit=tp, loss=sl, stop=longStopPrice, alert_message='closelong')
//strategy.exit("shorttp/sl","short",profit=tp, loss=sl, stop=shortStopPrice, alert_message='closeshort')

//tpatrlong= close + atr(atrRange) * targetATR
//slatrlong= close - atr(atrRange) * buyStop

//strategy.exit("longtp/sl","long",profit=tp, loss=sl, alert_message='closelong')
//strategy.exit("shorttp/sl","short",profit=tp, loss=sl, alert_message='closeshort')

strategy.exit("closelong", "long" , profit = close * tp / syminfo.mintick, loss = close * sl / syminfo.mintick, alert_message = "closelong")
strategy.exit("closeshort", "short" , profit = close * tp / syminfo.mintick, loss = close * sl / syminfo.mintick, alert_message = "closeshort")

if(BGcolor==color.yellow or not c_time)
    strategy.close("short", comment="time or yellow", alert_message='closeshort')
    strategy.close("long", comment="time or yellow", alert_message='closelong')