Estrategia de súper impulso

Descripción general
La estrategia de súper dinámica utiliza una combinación de varios indicadores de dinámica para realizar operaciones de compra o venta cuando varios indicadores de dinámica están a la vez en alza o baja. La estrategia, mediante la combinación de varios indicadores de dinámica, puede capturar con mayor precisión la tendencia de los precios y evitar las señales erróneas causadas por un solo indicador.
Principio de estrategia
La estrategia utiliza al mismo tiempo cuatro indicadores RMI de Everget y un indicador de oscilación de la dinámica de Chande. El indicador RMI se basa en el cálculo de la dinámica de los precios y puede determinar la fuerza de subida y bajada de los precios.
La operación de compra se realiza cuando RMI5 pasa por su línea de compra, RMI4 pasa por su línea de compra, RMI3 pasa por su línea de compra, RMI2 pasa por su línea de compra, RMI1 pasa por su línea de compra y Chande MO pasa por su línea de compra.
La operación de venta se realiza cuando RMI5 atraviesa su línea de venta, RMI4 su línea de venta, RMI3 su línea de venta, RMI2 su línea de venta, RMI1 su línea de venta y Chande MO su línea de venta.
El RMI5 se establece en la dirección opuesta a la de otros indicadores RMI, lo que permite identificar mejor las tendencias y realizar operaciones piramidales.
Análisis de las ventajas
-
La integración de varios indicadores permite determinar las tendencias con mayor precisión y evitar señales erróneas en un solo indicador
-
Incluye indicadores de varios períodos de tiempo para identificar tendencias a mayor escala
-
El indicador de RMI inverso puede ayudar a identificar tendencias y operar la pirámide
-
Chande MO ayuda a evitar errores en las transacciones de sobreventa
Análisis de riesgos
-
Combinaciones de indicadores excesivas, configuración de parámetros compleja, que requiere pruebas cuidadosas y optimización
-
Cuando varios indicadores cambian al mismo tiempo, puede producirse una señal errónea
-
La combinación de varios indicadores podría hacer que la frecuencia de las transacciones sea más baja
-
Necesidad de prestar atención a si los parámetros indicadores son adecuados para diferentes variedades y entornos de mercado
Dirección de optimización
-
Configuración de los parámetros de los indicadores de prueba y optimización de los parámetros para mejorar la estabilidad de la estrategia
-
Intentar aumentar o disminuir algunos indicadores para evaluar el impacto en la calidad de la señal
-
Se pueden introducir condiciones de filtración para evitar señales erróneas en determinadas situaciones de mercado
-
Ajustar la posición de la línea de compra y venta del indicador para encontrar la combinación óptima de parámetros
-
Considerar la inclusión de un mecanismo de suspensión de pérdidas para controlar el riesgo
Resumir
Esta estrategia mejora la capacidad de juicio sobre las tendencias del mercado mediante el uso integrado de varios indicadores dinámicos. Sin embargo, la configuración de los parámetros es compleja y requiere una prueba cuidadosa para optimizar, mejorar y ajustar constantemente. Si se utiliza correctamente, se espera obtener una señal de negociación superior y tener una cierta ventaja en el seguimiento de las tendencias del mercado.
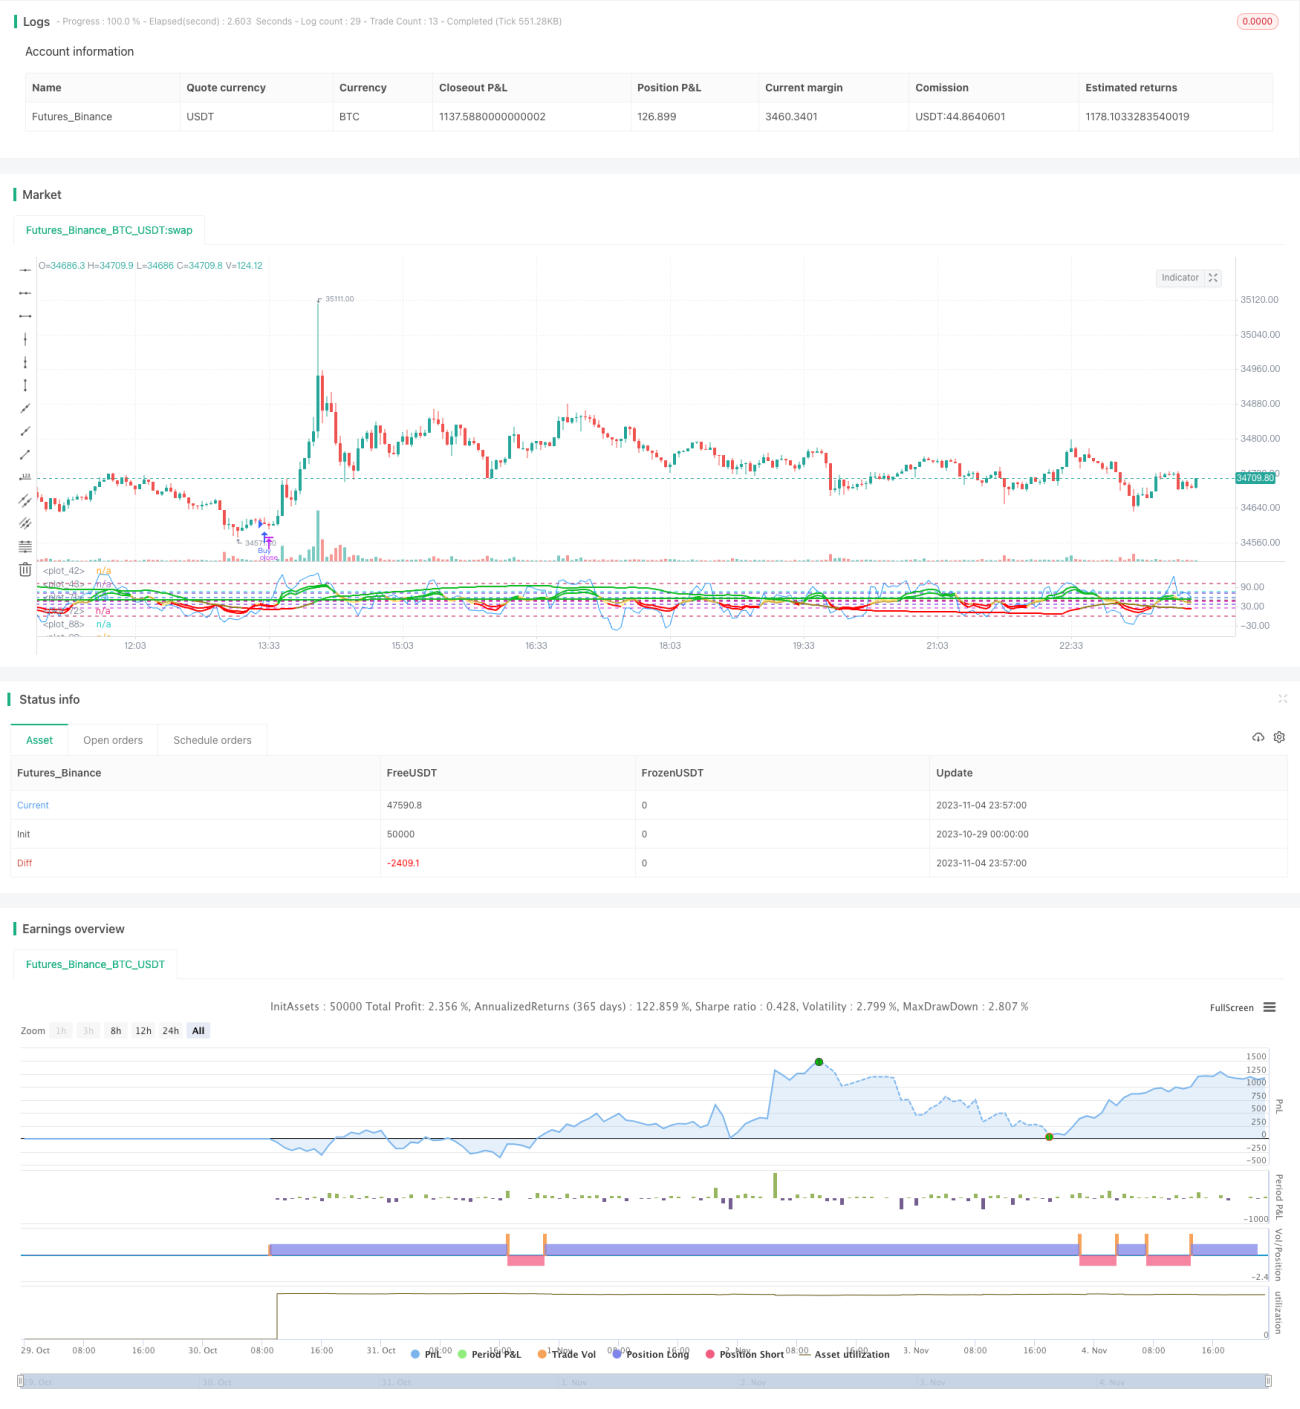
/*backtest
start: 2023-10-29 00:00:00
end: 2023-11-05 00:00:00
period: 3m
basePeriod: 1m
exchanges: [{"eid":"Futures_Binance","currency":"BTC_USDT"}]
*/

//@version=4
strategy(title="Super Momentum Strat", shorttitle="SMS", format=format.price, precision=2)

//* Backtesting Period Selector | Component *//- 1