Estrategia de seguimiento de tendencias basada en kNN

Descripción general
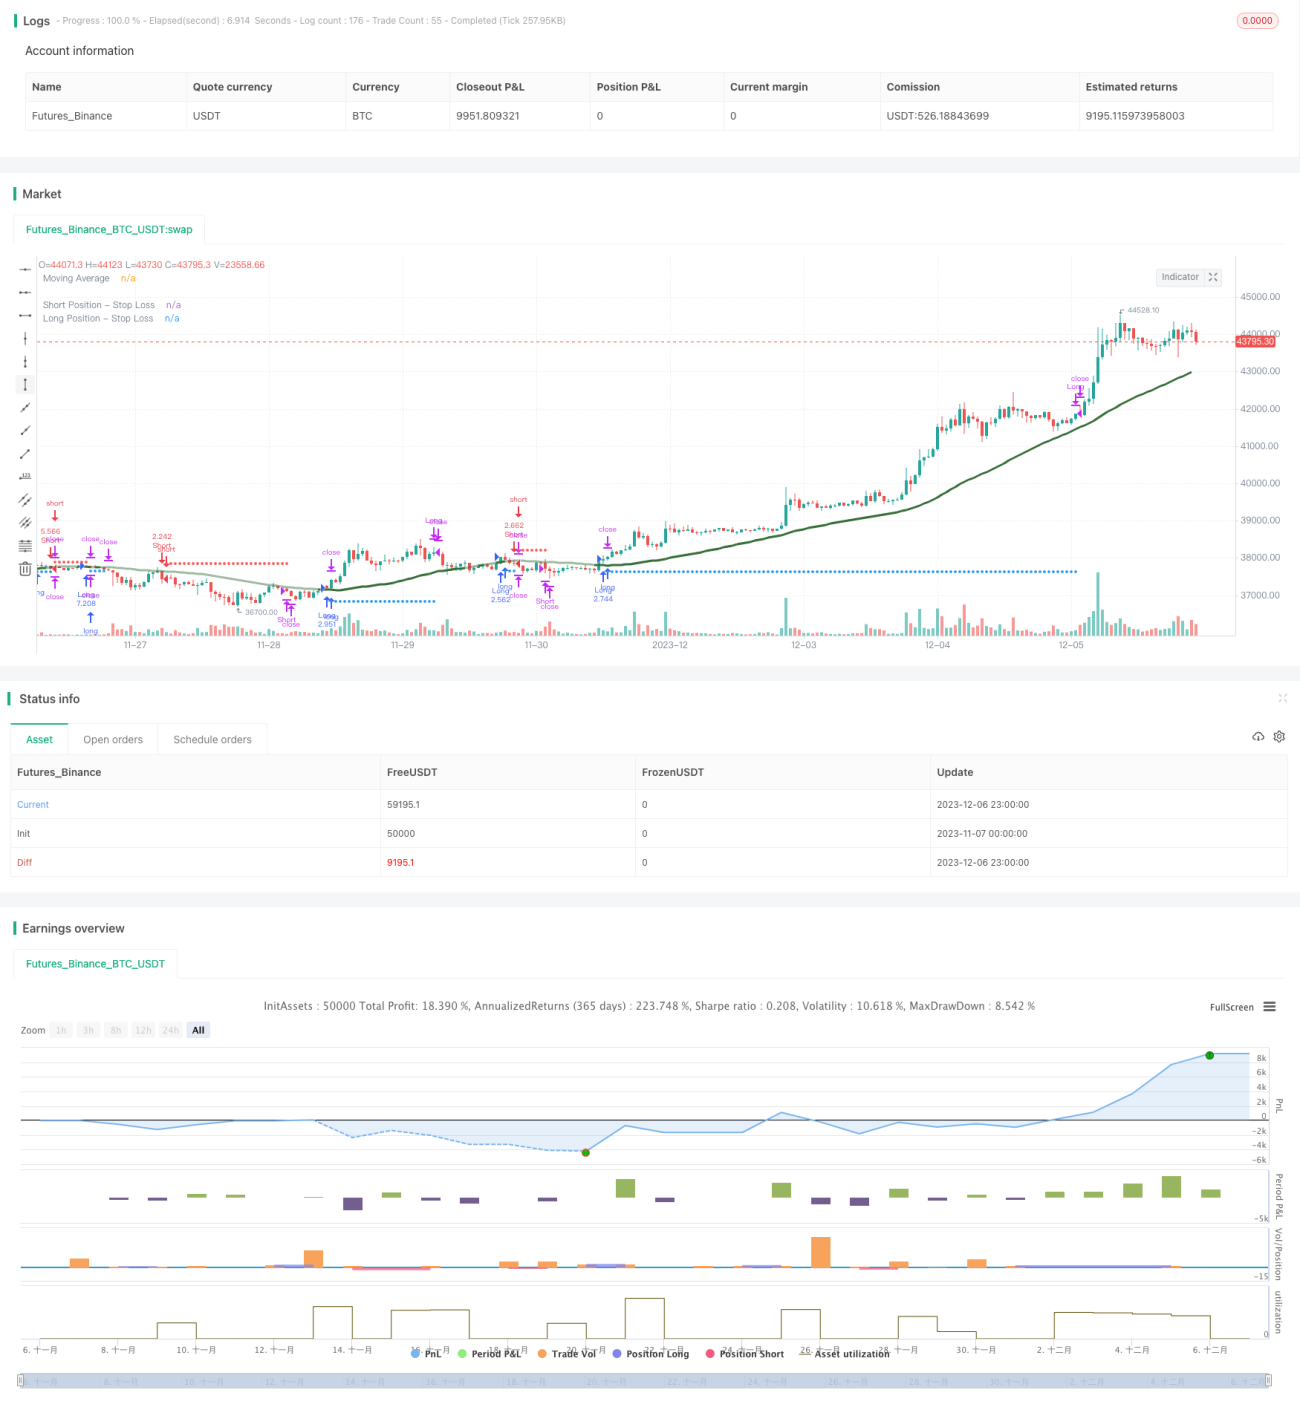
Esta estrategia utiliza kNN algoritmos de aprendizaje automático para predecir las tendencias del mercado y generar señales de posiciones largas y vacías en función de los resultados de la predicción. La estrategia considera de manera integral múltiples factores, como datos históricos, indicadores técnicos, y adquiere características del mercado mediante el entrenamiento de la dinámica del modelo de kNN para automatizar el seguimiento de tendencias de las operaciones.
Principio de estrategia
-
Recopilación de datos de entrenamiento: recopilación de secuencias de tiempo como el precio de cierre histórico, el volumen de operaciones, así como indicadores técnicos como el RSI, el CCI.
-
Preprocesamiento de datos: Unificación de los valores del indicador en el intervalo de 0 a 100.
-
Entrenamiento del modelo kNN: introducir dos características del modelo kNN actual, calcular la distancia europea entre estos vectores de características y los vectores de características históricas, seleccionar la distancia más cercana a k muestras históricas y estadizar la distribución de las etiquetas de esta k muestra:
-
Obtención de predicciones: predicción de la tendencia actual del mercado basado en las etiquetas de k muestras más cercanas. Si la predicción es de más cabezas, produce una señal de posición larga; si la predicción es de cabezas vacías, produce una señal de posición vacía.
-
Se puede negociar con filtros como el Stop Loss, el Control de Posiciones y el Moving Average.
Ventajas estratégicas
-
Utiliza algoritmos de aprendizaje automático para identificar formas de tecnología sin necesidad de intervención humana.
-
Se puede elegir con flexibilidad diferentes indicadores técnicos como características del modelo y estrategias de optimización en tiempo real.
-
Estricto mecanismo de control de riesgos, incluido el control de pérdidas y la gestión de posiciones.
-
La visualización presenta una línea de pérdida, clara e intuitiva.
Riesgos y soluciones
-
La predicción de aprendizaje automático puede presentar errores. Se pueden elegir modelos de optimización como el valor de k, el vector de característica y el rango de tiempo de muestra adecuados.
-
Hay un riesgo potencial de transacciones unilaterales. Se puede agregar transacciones bilaterales en el código para eliminar errores.
-
Si no se ajustan correctamente los parámetros, pueden ocasionar exceso de operaciones. Se deben ajustar adecuadamente los parámetros de tamaño de posición, frecuencia de operaciones, etc.
Dirección de optimización
-
Prueba de diferentes tipos de indicadores técnicos como características de la entrada de KNN.
-
Prueba otras medidas de distancia, como la distancia de Manhattan.
-
Ajuste el tamaño de la posición con la distancia de la muestra o la clasificación de la calidad.
-
Añadir el conjunto de entrenamiento del modelo, dividir el conjunto de pruebas y lograr la optimización de la rotación.
Resumir
Esta estrategia utiliza el clásico algoritmo de KNN para realizar predicciones de tendencias del mercado y realizar operaciones de seguimiento de tendencias según las señales de predicción. La estrategia tiene características de ajustabilidad de parámetros y control de riesgos, que pueden proporcionar a los usuarios un programa de comercio automatizado eficaz.
- 1