
La estrategia se basa en el indicador de tendencia y el seguimiento de la parada para abrir posiciones de paz. Utiliza 4 alarmas para abrir posiciones de paz y utiliza la estrategia de tendencia. La estrategia está diseñada específicamente para robots y tiene la función de seguimiento de la parada.
La estrategia utiliza el indicador ATR para calcular el ascenso y el descenso. La estrategia genera una señal de compra cuando el precio de cierre rompe la vía ascendente y una señal de venta cuando rompe la vía descendente. La estrategia también utiliza una línea de tendencia para determinar la dirección de la tendencia.
La estrategia combina las ventajas de los indicadores de tendencia de ultratrend para determinar la dirección de la tendencia y los indicadores de ATR para establecer los paros, lo que permite filtrar eficazmente las brechas falsas. El seguimiento de los paros puede bloquear bien los beneficios y reducir las retracciones. Además, la estrategia está diseñada específicamente para robots y puede automatizar las operaciones.
Los indicadores de tendencia son propensos a generar más señales erróneas. Cuando el precio de parada se ajusta más ampliamente, aumenta la probabilidad de que se rompa el stop. Además, el comercio de robots también enfrenta riesgos técnicos como el cierre del servidor y la interrupción de la red.
Para reducir la probabilidad de señales erróneas, se puede ajustar adecuadamente los parámetros ATR o agregar otros indicadores para filtrar. Al ajustar la amplitud de seguimiento de stop loss, se necesita equilibrar la ganancia y el riesgo. Al mismo tiempo, prepárese para servidores y redes de respaldo para evitar el riesgo de fallas técnicas.
La estrategia puede ser optimizada en los siguientes aspectos:
Añadir indicadores o condiciones para filtrar las señales de entrada y evitar señales falsas. Por ejemplo, se puede agregar un indicador MACD.
Se pueden probar diferentes combinaciones de parámetros ATR para encontrar el mejor parámetro.
Se puede optimizar la amplitud de seguimiento de stop loss para encontrar el punto de equilibrio óptimo.
Se puede agregar más precios de stop loss para lograr el stop loss por lotes.
Se puede crear una arquitectura de servidor principal de reserva para cambiar rápidamente en caso de fallo del servidor principal.
Esta estrategia integra las ventajas de los indicadores de tendencia y el seguimiento de los paros, lo que permite automatizar la apertura de posiciones y los paros. Las mejoras en la dirección de optimización combinadas con las medidas reales pueden ser una estrategia de comercio cuantitativa muy práctica.
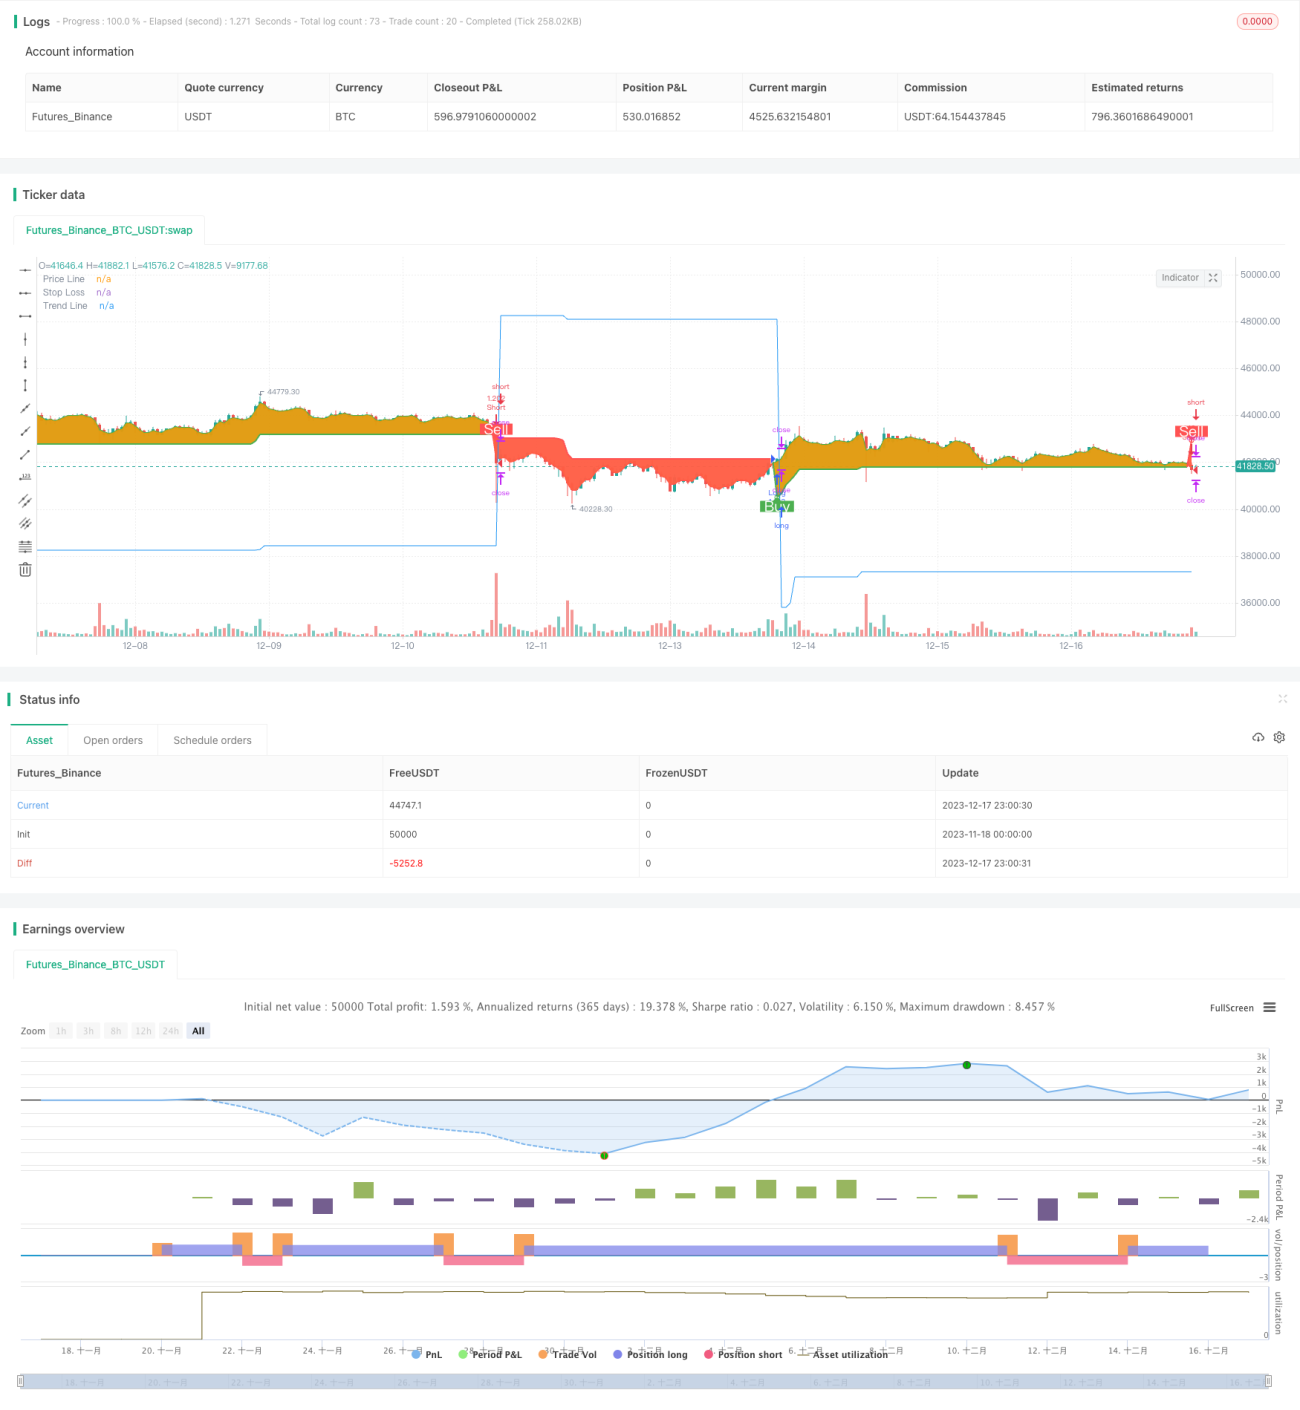
/*backtest
start: 2023-11-18 00:00:00
end: 2023-12-18 00:00:00
period: 1h
basePeriod: 15m
exchanges: [{"eid":"Futures_Binance","currency":"BTC_USDT"}]
*/
// This source code is subject to the terms of the Mozilla Public License 2.0 at https://mozilla.org/MPL/2.0/
// © arminomid1375
//@version=5
strategy('Mizar_BOT_super trend', overlay=true, default_qty_value=100, currency=currency.USD, default_qty_type=strategy.percent_of_equity, initial_capital=100, max_bars_back=4000)
//===== INPUTS ==========================================================================//
factor = input.float(4.5, title='ATR Factor', step=0.1,group = 'ATR')
period = input.int(59, minval=1, maxval=100, title='ATR Period',group = 'ATR')
up = (high + low) / 2 - factor * ta.atr(period)
down = (high + low) / 2 + factor * ta.atr(period)
trend_up = 0.0
trend_up := close[1] > trend_up[1] ? math.max(up, trend_up[1]) : up
trend_down = 0.0
trend_down := close[1] < trend_down[1] ? math.min(down, trend_down[1]) : down
trend = 0.0
trend := close > trend_down[1] ? 1 : close < trend_up[1] ? -1 : nz(trend[1], 1)
tsl = trend == 1 ? trend_up : trend_down
line_color = trend == 1 ? 'green' : 'red'
long_signal = trend == 1 and trend[1] == -1
short_signal = trend == -1 and trend[1] == 1
background = true
//ss = input.float(defval=15.0, minval=0.0, title=' stop loss %',group = 'stop loss')
use_sl = input(title='trailing stop ?', defval=true,group = 'stop loss')
initial_sl_pct = input.float(defval=15.0, minval=0.0, title='trailing stop %',group = 'stop loss')
Tpactive1 = input(title='Take profit1 On/Off ?', defval=true, group='take profit')
tp1percent = input.float(5.0, title='TP1 %', group='take profit') *100
tp1amt = input.int(10, title='TP1 Amount %', group='take profit')
Tpactive2 = input(title='Take profit2 On/Off ?', defval=true, group='take profit')
tp2percent = input.float(10, title='TP2 %', group='take profit') *100
tp2amt = input.int(15, title='TP2 Amount %', group='take profit')
Tpactive3 = input(title='Take profit3 On/Off ?', defval=true, group='take profit')
tp3percent = input.float(15, title='TP3 %', group='take profit')*100
tp3amt = input.int(20, title='TP3 Amount %', group='take profit')
//===== TIMEFRAME ==========================================================================//
from_month = input.int(defval=1, title='From Month', minval=1, maxval=12)
from_day = input.int(defval=1, title='From Day', minval=1, maxval=31)
from_year = input.int(defval=2019, title='From Year', minval=2017)
to_month = input.int(defval=1, title='To Month', minval=1, maxval=12)
to_day = input.int(defval=1, title='To Day', minval=1, maxval=31)
to_year = input.int(defval=9999, title='To Year', minval=2017)
start = timestamp(from_year, from_month, from_day, 00, 00)
finish = timestamp(to_year, to_month, to_day, 23, 59)
window() =>
time >= start and time <= finish ? true : false
//===== PLOTS ==========================================================================//
// Line
line_plot = plot(tsl, color=trend == 1 ? color.green : color.red, linewidth=2, title='Trend Line')
// Labels
plotshape(long_signal and window() ? up : na, title='Buy', text='Buy', location=location.absolute, style=shape.labelup, size=size.normal, color=color.new(color.green, 0), textcolor=color.new(color.white, 0))
plotshape(short_signal and window() ? down : na, title='Sell', text='Sell', location=location.absolute, style=shape.labeldown, size=size.normal, color=color.new(color.red, 0), textcolor=color.new(color.white, 0))
// Circles
plotshape(long_signal and window() ? up : na, title='Uptrend starts', location=location.absolute, style=shape.circle, size=size.tiny, color=color.new(color.green, 0))
plotshape(short_signal and window() ? down : na, title='Downtrend starts', location=location.absolute, style=shape.circle, size=size.tiny, color=color.new(color.red, 0))
// Background
long_fill = background ? trend == 1 ? color.green : na : na
short_fill = background ? trend == -1 ? color.red : na : na
candle_plot = plot(ohlc4, title='Price Line', color=trend == 1 ? long_fill : short_fill, linewidth=2, transp=90)
fill(candle_plot, line_plot, title='Long Background', color=long_fill, transp=90)
fill(candle_plot, line_plot, title='Short Background', color=short_fill, transp=90)
//===== GLOBAL ==========================================================================//
var entry_price = 0.0
var updated_entry_price = 0.0
var sl_price = 0.0
longString = "Input your custom alert message here.\nAnd put {{strategy.order.alert_message}} in the message box."
longclose = "Input your custom alert message here.\nAnd put {{strategy.order.alert_message}} in the message box."
shortString = "Input your custom alert message here.\nAnd put {{strategy.order.alert_message}} in the message box."
shortclose = "Input your custom alert message here.\nAnd put {{strategy.order.alert_message}} in the message box."
longAlertMessage = input(title="Long Alert Message", defval="long", group="Alert Messages", tooltip=longString)
longcloseAlertMessage = input(title="Long close Alert Message", defval="long", group="Alert Messages", tooltip=longclose)
shortAlertMessage = input(title="Short Alert Message", defval="short", group="Alert Messages", tooltip=shortString)
shortcloseAlertMessage = input(title="Short close Alert Message", defval="short", group="Alert Messages", tooltip=shortclose)
has_open_trade() =>
strategy.position_size != 0
has_no_open_trade() =>
strategy.position_size == 0
is_long() =>
strategy.position_size > 0 ? true : false
is_short() =>
strategy.position_size < 0 ? true : false
plot(use_sl ? has_no_open_trade() ? close : sl_price : na, color=has_no_open_trade() ? na : color.blue, title='Stop Loss')
strategy_close() =>
if is_long()
strategy.close('Long')
alert(longcloseAlertMessage)
if is_short()
strategy.close('Short')
alert(shortcloseAlertMessage)
strategy_long() =>
strategy.entry('Long', strategy.long)
strategy_short() =>
strategy.entry('Short', strategy.short)
sl_pct = initial_sl_pct
if long_signal or is_long() and not(short_signal or is_short())
sl_pct := initial_sl_pct * -1
sl_pct
//===== STRATEGY ==========================================================================//
crossed_sl = false
if is_long() and use_sl
crossed_sl := close <= sl_price
crossed_sl
if is_short() and use_sl
crossed_sl := close >= sl_price
crossed_sl
terminate_operation = window() and has_open_trade() and crossed_sl
if terminate_operation and not(long_signal or short_signal) // Do not close position if trend is flipping anyways.
entry_price := 0.0
updated_entry_price := entry_price
sl_price := 0.0
strategy_close()
start_operation = window() and (long_signal or short_signal)
if start_operation
entry_price := close
updated_entry_price := entry_price
sl_price := entry_price + entry_price * sl_pct / 100
if long_signal
strategy_long()
if Tpactive1==true
strategy.exit('TPL1','Long', qty_percent=tp1amt,profit =tp1percent)
alert(shortcloseAlertMessage)
alert(longAlertMessage)
if short_signal
strategy_short()
if Tpactive1==true
strategy.exit('TPL1','Short', qty_percent=tp1amt,profit =tp1percent)
alert(longcloseAlertMessage)
alert(shortAlertMessage)
//===== TRAILING ==========================================================================//
if is_long() and use_sl
strategy_pct = (close - updated_entry_price) / updated_entry_price * 100.00
if strategy_pct > 1
sl_pct += strategy_pct - 1.0
new_sl_price = updated_entry_price + updated_entry_price * sl_pct / 100
sl_price := math.max(sl_price, new_sl_price)
updated_entry_price := sl_price
updated_entry_price
if is_short() and use_sl
strategy_pct = (close - updated_entry_price) / updated_entry_price * 100.00
if strategy_pct < -1
sl_pct += strategy_pct + 1.0
new_sl_price = updated_entry_price + updated_entry_price * sl_pct / 100
sl_price := math.min(sl_price, new_sl_price)
updated_entry_price := sl_price
updated_entry_price