Estrategia de ruptura de impulso en múltiples marcos temporales
Descripción general
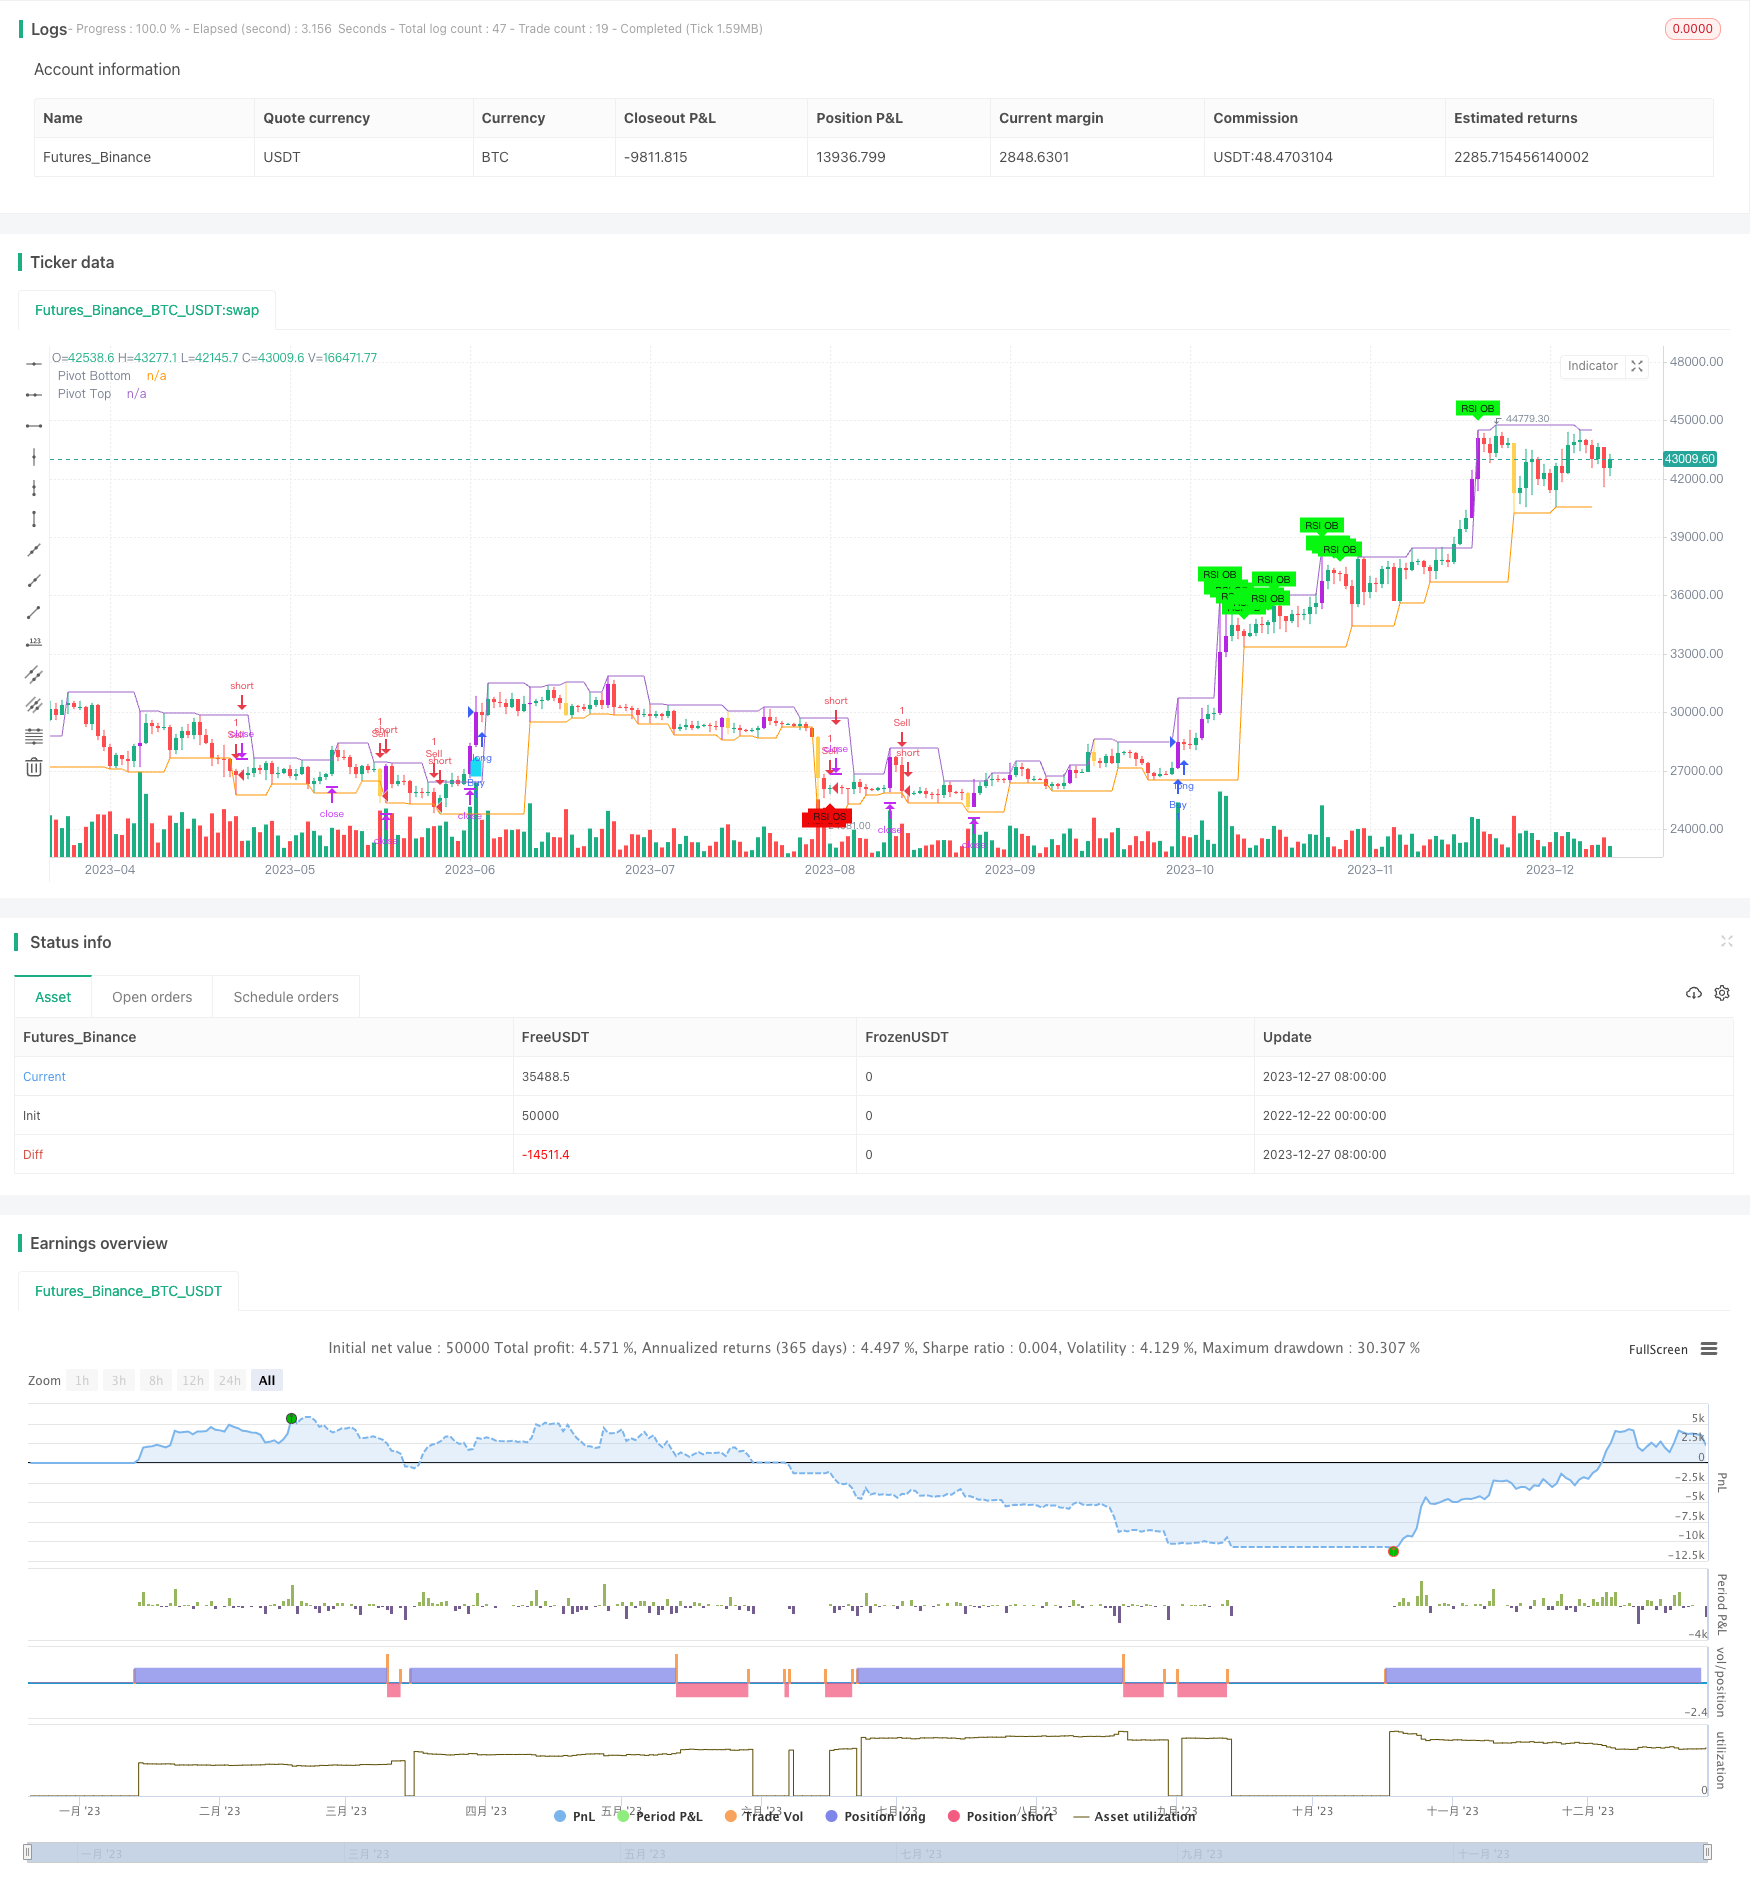
La estrategia combina varios indicadores técnicos, como RSI, ADX, ATR, e indicadores de dinámica, para permitir el juicio de la tendencia y la captura de los puntos de ruptura. La estrategia también combina la línea de retracción y la línea media de Fibonacci para mejorar aún más la precisión de los juicios de los puntos clave y la tendencia.
Principio de estrategia
Los indicadores RSI, ADX, DI +, DI- para determinar la dirección y la fuerza de la tendencia. El RSI puede reflejar sobrecompras y sobreventa, el ADX refleja la fuerza de la tendencia, y el DI + / DI- para determinar la tendencia de la cabeza y la cabeza vacía. Los valores de estos indicadores se muestran en la tabla en la esquina superior derecha para facilitar la determinación.
En combinación con la línea media, se determina la dirección de la tendencia. Se utilizan los EMA de los días 5 y 9 para determinar la tendencia a corto plazo, el WMA de los días 21 para determinar la tendencia a medio plazo y el WMA de los días 60 para determinar la tendencia a largo plazo.
Utiliza la línea de retroceso de Fibonacci para buscar puntos de soporte clave como 0.5, 0.618 y otros. Estos puntos suelen ser puntos de reversión potenciales.
Establezca un precio de parada basado en el ATR y el Stop Loss Ratio para controlar el riesgo. Establezca un precio de parada basado en el ATR y el Stop Loss Ratio para bloquear los beneficios.
Cuando se produzca una señal de RSI de sobreventa y sobreventa, considere la reversión de la entrada. Considere la entrada de seguimiento de la tendencia cuando la línea media a corto plazo se rompa y la línea media a largo plazo se rompa y el volumen de transacciones se incremente.
Análisis de las ventajas
El uso integrado de varios indicadores para determinar la dirección y la intensidad de las tendencias aumenta la precisión de la toma de decisiones.
El mecanismo de detención de pérdidas basado en el ATR controla el riesgo de manera efectiva.
Combinado con el punto clave de Fibonacci, mejora la precisión del juicio del punto de inflexión.
El aumento del volumen de transacciones sirve como condición para seguir la tendencia y evitar falsas rupturas.
Las tablas muestran de forma intuitiva los valores actuales de varios indicadores, lo que facilita el juicio y la toma de decisiones rápidas.
Análisis de riesgos
La probabilidad de que el indicador emita una señal errónea no se puede evitar por completo, lo que lleva al riesgo de operaciones erróneas. Los parámetros del indicador se pueden optimizar ajustando los parámetros.
El ATR y el parámetro de pérdidas afectan el parámetro de pérdidas reales. Si el parámetro es demasiado grande o demasiado pequeño, se corre el riesgo y se necesita un equilibrio.
El aumento del volumen de transacciones como condición de entrada no puede evitar completamente la aparición de falsas rupturas, y es necesario combinar los detalles de la situación de los precios.
El punto de Fibonacci tampoco es 100% fiable, y el precio puede romper directamente a través de este punto.
Dirección de optimización
Para probar y optimizar los parámetros RSI, ADX, ATR, etc., para encontrar la combinación óptima de parámetros.
Prueba diferentes combinaciones de líneas medias para determinar cuáles son las mejores para determinar el efecto de la tendencia.
Prueba diferentes parámetros de la proporción de stop loss y stop loss para encontrar los parámetros óptimos para el riesgo y la ganancia.
Se puede considerar la inclusión del indicador BollingerBands para determinar el efecto de aumento del volumen de operaciones.
Resumir
Esta estrategia utiliza una variedad de técnicas, como la determinación de tendencias, la determinación de puntos clave, el análisis de volumen de operaciones, etc. La optimización de los parámetros mejora aún más la precisión y la rentabilidad de la determinación. La configuración de stop loss controla el riesgo y maximiza la rentabilidad.
/*backtest
start: 2022-12-22 00:00:00
end: 2023-12-28 00:00:00
period: 1d
basePeriod: 1h
exchanges: [{"eid":"Futures_Binance","currency":"BTC_USDT"}]
*/

// This source code is subject to the terms of the Mozilla Public License 2.0 at https://mozilla.org/MPL/2.0/
// © amit74sharma135

//@version=5

strategy(" KritikSharma Strategy for NIFTY,BNIFTY,NG,CRUDE,WTICrude,BTC,GOLD,SILVER,COPPER", overlay=true)
plotHVB = input.bool(defval=true, title='Plot HVB')
plotPVT = input.bool(defval=false, title='Plot Pivots')
hvbEMAPeriod = input.int(defval=12, minval=1, title='Volume EMA Period')
hvbMultiplier = input.float(defval=1.5, title='Volume Multiplier')
pivotLookup = input.int(defval=2, minval=1, maxval=15, title='Pivot Lookup')
ShowAvg1 = input(false, title="Show trend line", group="TREND LINE Moving Average", tooltip="Display a trend line based on EMA.")
showLines1 = input.bool(defval=false, title="Draw EMA,WMA Line")
ema200_length= input.int(defval=200, minval=1, maxval=500, title='ema1')
ema300_length= input.int(defval=300, minval=1, maxval=500, title='ema2')
wma60_length= input.int(defval=60, minval=1, maxval=100, title='wma60')
ema5 = ta.ema(close, 5)
ema9 = ta.ema(close, 9)
wma21=ta.wma(close,21)
wma60=ta.wma(close,wma60_length)
len1 = input.int(11, minval=1, maxval=500, title="Length", group="TREND LINE Moving Average", tooltip="Set EMA length.")
ema=ta.ema(close, len1)
rsiLength = input.int(14, title="RSI Length", minval=1, maxval=50, group="Table ADX, RSI, DI values with Red, Green, Yellow Signal")
adxLength = input.int(14, title="ADX Length", minval=1, maxval=50, group="Table ADX, RSI, DI values with Red, Green, Yellow Signal")
adxThreshold = input.int(20, title="ADX Threshold", group="Table ADX, RSI, DI values with Red, Green, Yellow Signal")
diThreshold = input.int(25, title="DI Threshold", group="Table ADX, RSI, DI values with Red, Green, Yellow Signal")
atr = input.int(14, title="ATR values", group="Table ADX, RSI, DI values with Red, Green, Yellow Signal")
////////////////////////////////////////////////

hvbBullColor = color.rgb(181, 37, 225)
hvbBearColor = #ffbb00ad

pvtTopColor = color.new(#154bef, 0)
pvtBottomColor = color.new(#b81657, 0)

//////////////////// Pivots ////////////////////
hih = ta.pivothigh(high, pivotLookup, pivotLookup)
lol = ta.pivotlow(low , pivotLookup, pivotLookup)
top1 = ta.valuewhen(hih, high[pivotLookup], 0)
bottom1 = ta.valuewhen(lol, low [pivotLookup], 0)
plot(top1, offset=-pivotLookup, linewidth=1, color=(top1 != top1[1] ? na : (plotPVT ? pvtTopColor : na)), title="Pivot Top")
plot(bottom1, offset=-pivotLookup, linewidth=1, color=(bottom1 != bottom1[1] ? na : (plotPVT ? pvtBottomColor : na)), title="Pivot Bottom")

//////////////////////////////////////Functions
isUp(index) =>
    close[index] > open[index]

isDown(index) =>
    close[index] < open[index]

isObUp(index) =>
    isDown(index + 1) and isUp(index) and close[index] > high[index + 1]

isObDown(index) =>
    isUp(index + 1) and isDown(index) and close[index] < low[index + 1]
////////////////// High Volume Bars //////////////////
volEma = ta.ema(volume, hvbEMAPeriod)
isHighVolume = volume > (hvbMultiplier * volEma)
barcolor(plotHVB and isUp(0) and isHighVolume ? hvbBullColor : na, title="Bullish HVB")
barcolor(plotHVB and isDown(0) and isHighVolume ? hvbBearColor : na, title="Bearish HVB")

// Calculate ADX, DI+,  DI-,RSI,ATR
[diplus, diminus, adx] = ta.dmi(adxLength, adxThreshold)
rsi=ta.rsi(close,rsiLength)
atrValue=ta.atr(atr)

// Check for oversold,Overbought condition
oversold_condition = rsi < 20
overbought_condition = rsi > 80

// Plot Trend Line
trendColor = ema5 > ema9 ? color.rgb(22, 203, 28) : ema5 < ema9 ? color.rgb(224, 15, 15) : na
plot(ShowAvg1? ema:na, color=trendColor, linewidth=6, title="Trend Line Upper Ribbon")

/////////////////////////plot ema,wma
plot(showLines1 ? ta.ema(close, ema200_length) : na, color=color.rgb(102, 110, 103), style=plot.style_line, title="ema1",linewidth = 4)
plot(showLines1 ? ta.ema(close, ema300_length) : na, color=color.rgb(18, 20, 18), style=plot.style_line, title="ema2",linewidth = 4)
plot(showLines1 ? ta.wma(close, wma60_length) : na, color=color.rgb(238, 75, 211), style=plot.style_line, title="wma60",linewidth = 3)

// Plot signals with smaller text
plotshape(oversold_condition ? 1 : na, title="RSI Oversold Signal", color=color.rgb(238, 8, 8), style=shape.labelup, location=location.belowbar, text="RSI OS", textcolor=color.rgb(17, 17, 17), size=size.tiny)
plotshape(overbought_condition ? 1 : na, title="RSI Overbought Signal", color=#08f710, style=shape.labeldown, location=location.abovebar, text="RSI OB", textcolor=color.rgb(8, 8, 8), size=size.tiny)
///////////////////////////////////////////////////////////////////////////////////////////////

// Define input options
showTable = input(false, title="Show Table ADX, RSI, DI values with RED, GREEN and YELLOW Signal")
tablePosition = input.string("Top Right", title="Table Position", options=["Top Right", "Top Left", "Top Center", "Bottom Right", "Bottom Left", "Bottom Center"])

// Define colors for the table cells
colorRsi = rsi > 55 ? color.green : rsi < 45 ? color.red : color.yellow
colorDiPlus = diplus > diThreshold ? color.green : color.red
colorDiMinus = diminus > diThreshold ? color.red : color.green
colorAdx = (rsi < 45 and diplus < diThreshold and diminus > diThreshold and adx > adxThreshold) ? color.red :
           (rsi > 55 and diplus > diThreshold and diminus < diThreshold and adx > adxThreshold) ? color.green :
           color.yellow

// Create the table
var table testTable = na
if showTable
    var position = tablePosition == "Top Right" ? position.top_right :
                   tablePosition == "Top Left" ? position.top_left :
                   tablePosition == "Top Center" ? position.top_center :
                   tablePosition == "Bottom Right" ? position.bottom_right :
                   tablePosition == "Bottom Left" ? position.bottom_left :
                   position.bottom_center

    testTable := table.new(position, columns = 4, rows = 2, border_width = 1, border_color = color.black, frame_width = 1, frame_color = color.black)

    // Column Headings
    table.cell(table_id = testTable, column = 0, row = 0, text = " DI+ ", bgcolor=color.aqua, text_color = color.white)
    table.cell(table_id = testTable, column = 1, row = 0, text = " DI- ", bgcolor=color.aqua, text_color = color.white)
    table.cell(table_id = testTable, column = 2, row = 0, text = " ADX ", bgcolor=color.aqua, text_color = color.white)
    table.cell(table_id = testTable, column = 3, row = 0, text = " RSI ", bgcolor=color.aqua, text_color = color.white)

    // Column values
    table.cell(table_id = testTable, column = 0, row = 1, text = str.tostring(math.round(diplus, 0)), bgcolor=colorDiPlus, text_color = color.black)
    table.cell(table_id = testTable, column = 1, row = 1, text = str.tostring(math.round(diminus, 0)), bgcolor=colorDiMinus, text_color = color.black)
    table.cell(table_id = testTable, column = 2, row = 1, text = str.tostring(math.round(adx, 0)), bgcolor=colorAdx, text_color = color.black)
    table.cell(table_id = testTable, column = 3, row = 1, text = str.tostring(math.round(rsi, 0)), bgcolor=colorRsi, text_color = color.black)


// Initialize variables to keep track of the previous condition
var bool prev_oversold = na
var bool prev_overbought = na

plotshape(ta.crossover(ema,wma60) and isHighVolume,  style=shape.labelup, location=location.belowbar, color=#1adaf3,size=size.small)
plotshape(ta.crossunder(ema,wma60) and isHighVolume,  style=shape.labeldown, location=location.abovebar, color=#f30aa9, size=size.small)
//////////////////////////////////////////////////
plotFibRetracement = input.bool(title="Plot Fibonacci Retracement", defval=false)
fibLevel1 = input.float(title="Fibonacci Level", defval=0.5, minval=0, maxval=1, step=0.01)
fibLevel2 = input.float(title="Fibonacci Level", defval=0.618, minval=0, maxval=1, step=0.01)
fibLevel3 = input.float(title="Fibonacci Level", defval=0.368, minval=0, maxval=1, step=0.01)
// Calculate Fibonacci Levels
highPrice = ta.highest(high, 100)
lowPrice = ta.lowest(low, 100)
priceRange = highPrice - lowPrice
fibonacciLevel1 = lowPrice + priceRange * fibLevel1
fibonacciLevel2 = lowPrice + priceRange * fibLevel2
fibonacciLevel3 = lowPrice + priceRange * fibLevel3

// Plot Fibonacci Levels
if plotFibRetracement
    line.new(x1=bar_index[1], y1=fibonacciLevel1, x2=bar_index, y2=fibonacciLevel1, color=color.blue, width=2)
    line.new(x1=bar_index[1], y1=fibonacciLevel2, x2=bar_index, y2=fibonacciLevel2, color=color.blue, width=2)
    line.new(x1=bar_index[1], y1=fibonacciLevel3, x2=bar_index, y2=fibonacciLevel3, color=color.blue, width=2)
// Draw Trendline
var float trendlineY1 = na
var float trendlineY2 = na

if bar_index % 50 == 0
    trendlineY1 := low
    trendlineY2 := high

// line.new(x1=bar_index, y1=trendlineY1, x2=bar_index - 100, y2=trendlineY2, color=#3708a5, width=2)

////////////////////////////////////////////////entry, exit, profit booking, stoploss///////////////////////
if (rsi > 63 and adx> adxThreshold and diplus>diThreshold)
    strategy.entry("Buy", strategy.long, qty = 1)

if (rsi < 40 and adx> adxThreshold and diminus>diThreshold)
    strategy.entry("Sell", strategy.short, qty = 1)

// Set stop loss and take profit levels
stop_loss = input(1.5, title = "Stop Loss (%)") * atrValue
take_profit = input(4.0, title = "Take Profit (%)") * atrValue
strategy.exit("Take Profit/Stop Loss", from_entry = "Buy", stop = close - stop_loss, limit = close + take_profit)
strategy.exit("Take Profit/Stop Loss", from_entry = "Sell", stop = close + stop_loss, limit = close - take_profit)
////////////////////////