Estrategia de cruce de canales en Mobile Vegas
Fecha de creación:
2024-01-02 10:53:06
Última modificación:
2024-01-02 10:53:06
Copiar:
7
Número de Visitas:
1491
1
Seguir
1750
Seguidores
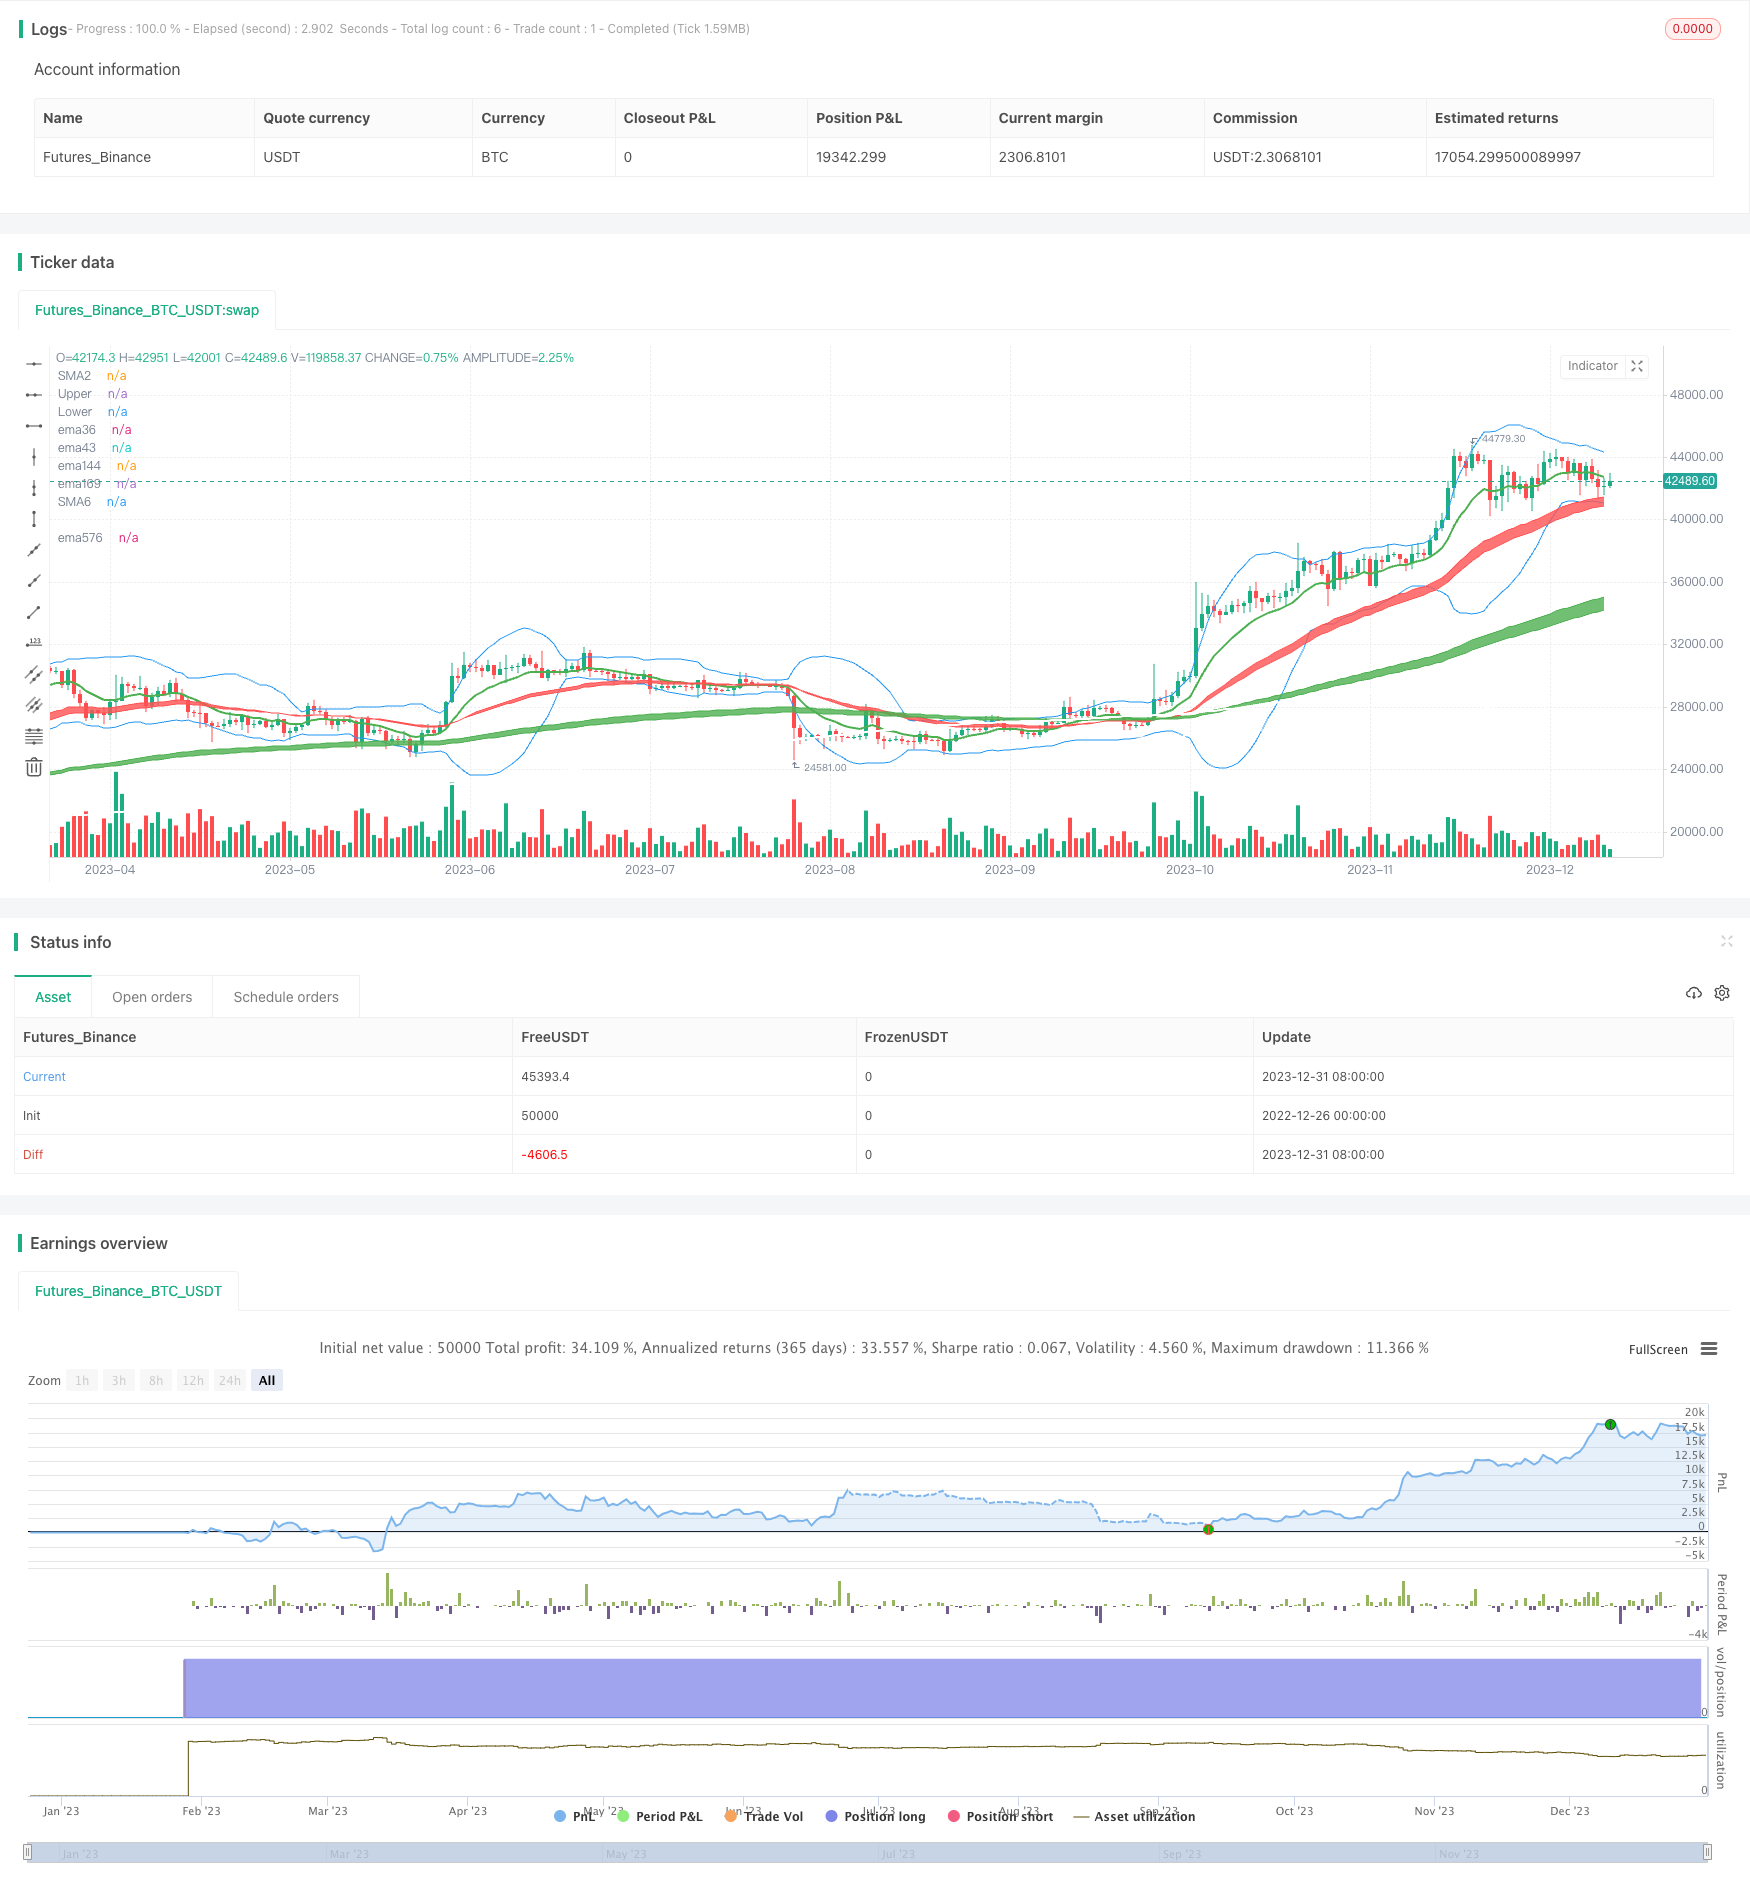
La idea central de esta estrategia es determinar la dirección de la tendencia a corto y largo plazo de las acciones en función de la línea media de los diferentes períodos, como el EMA 36,143,169, en combinación con el indicador MACD para emitir una señal de compra y venta. En concreto, el corto plazo se determina con el EMA de 5 y 10 días, el mediano con el EMA de 20 y 60 días y el largo con el EMA de 120 y 250 días.
Las estrategias del canal de Las Vegas incluyen:
- El uso de EMA36 y EMA43 para la determinación de tendencias a corto plazo, que forman el canal rojo;
- El uso de EMA144 y EMA169 para la determinación de tendencias a medio plazo, que constituyen el canal verde;
- El uso de EMA576 y EMA676 para la determinación de tendencias a largo plazo, que forman el canal gris;
- Se puede hacer más cuando el precio se encuentra en la línea de equilibrio de los EMA, y luego se combina con el indicador MACD para romper el eje 0 hacia arriba y emitir una señal de compra;
- Cuando el precio cae por debajo de las líneas medias de EMA, se puede hacer un descuento, y luego se combina con el indicador MACD para romper el eje 0 hacia abajo y emitir una señal de venta.
- Se dividen en tres estrategias de negociación de corto y largo plazo según el ciclo de la línea media EMA que atraviesa, respectivamente, para diferentes períodos de tenencia.
Las ventajas de esta estrategia se manifiestan principalmente en:
- La combinación de los tres canales, corto, mediano y largo, permite determinar la dirección de la tendencia, que es más estable.
- Las canales de Vegas son claras e intuitivas, así que es fácil juzgar las tendencias.
- La combinación de los indicadores MACD permite una mejor comprensión de los momentos de compra y venta.
- En el caso de las estrategias cortas y medianas, hay una mayor flexibilidad.
Los principales riesgos de esta estrategia son:
- Cuando los precios de las acciones fluctúan fuertemente, la media EMA genera un retraso y hay una gran probabilidad de error de juicio.
- Cuando los tres canales no coinciden, existe el riesgo de error de operación.
- La manipulación de la carta horaria requiere una mayor capacidad de resistencia psicológica.
Cómo hacer frente a esto:
- Se puede ajustar el ciclo de la línea media de la EMA apropiadamente para que coincida mejor con las características actuales del mercado.
- Ajuste de la proporción de las posiciones antes de la negociación para controlar las pérdidas individuales.
El espacio para la optimización de la estrategia:
- Las tendencias del canal de Vegas no son suficientes para distinguirlas, se puede introducir un juicio auxiliar del canal de Bryn.
- Los indicadores MACD no son efectivos para las situaciones de oscilación interbancaria, y pueden ser reemplazados por indicadores como KD, RSI, etc.
- Aumentar las estrategias de stop loss, como el stop loss activo cuando el precio de cierre cae por debajo de la EMA clave.
- La caída de la acción A tiene un gran impacto, se puede considerar el cobro de cobertura de un ETF.
Código Fuente de la Estrategia
/*backtest
start: 2022-12-26 00:00:00
end: 2024-01-01 00:00:00
period: 1d
basePeriod: 1h
exchanges: [{"eid":"Futures_Binance","currency":"BTC_USDT"}]
*/

//@version=4

strategy("Vegas Tunnel strategy", overlay=true)
//-------------------------------------------
//-------------------------------------------
// Inputs
useCurrentRes = input(true, title="Use Current Chart Resolution?")
resCustom = input(title="Use Different Timeframe? Uncheck Box Above", type=input.resolution, defval="D")
//tfSet = input(title = "Time Frame", options=["Current","120", "240", "D", "W"], defval="D")
tfSet = useCurrentRes ? timeframe.period : resCustom
maPeriods2 = input(12, "12 EMA")
maPeriods6 = input(240, "240 SMA")
BBlength = input(20, title="BB Length", minval=1)
BBsrc = input(close, title="BB Source")
mult = input(2.0, minval=0.001, maxval=50, title="BB StdDev")
sm2 = security(syminfo.tickerid, tfSet, ema(close, maPeriods2))
sm6 = security(syminfo.tickerid, tfSet, sma(close, maPeriods6))
p2 = plot(sm2, color=color.green, transp=30,  linewidth=2, title="SMA2")
p6 = plot(sm6, color=color.white, transp=30,  linewidth=2, title="SMA6")
//BB
basis = sma(BBsrc, BBlength)
dev = mult * stdev(BBsrc, BBlength)
upper = basis + dev
lower = basis - dev
offset = input(0, "BB Offset", type = input.integer, minval = -500, maxval = 500)
//plot(basis, "Basis", color=color.blue,linewidth, offset = offset)
pBB1 = plot(upper, "Upper", color=color.blue, offset = offset)
pBB2= plot(lower, "Lower", color=color.blue, offset = offset)

//MACD
fast_ma = ema(close, 48)
slow_ma = ema(close, 56)
macd = fast_ma - slow_ma

//vagas隧道
f1=ema(close, 36)
f2=ema(close, 43)
f3=ema(close, 144)
f4=ema(close, 169)
f5=ema(close, 576)
f6=ema(close, 676)
f7=ema(close,2304)
z1=plot(f1,color=color.red, title="ema36",transp=100)
z2=plot(f2,color=color.red, title="ema43",transp=100)
z3=plot(f3,color=color.green, title="ema144",transp=100)
z4=plot(f4,color=color.green, title="ema169",transp=100)
z5=plot(f5,color=color.white, title="ema576",transp=100)
z6=plot(f6,color=color.white, title="ema676",transp=100)
fill(z1, z2, color=color.red,transp=60)
fill(z3, z4, color=color.green,transp=60)
fill(z5, z6, color=color.gray,transp=60)

// Make input options that configure backtest date range
startDate = input(title="Start Date", type=input.integer,
     defval=1, minval=1, maxval=31)
startMonth = input(title="Start Month", type=input.integer,
     defval=1, minval=1, maxval=12)
startYear = input(title="Start Year", type=input.integer,
     defval=2018, minval=1800, maxval=2100)
endDate = input(title="End Date", type=input.integer,
     defval=1, minval=1, maxval=31)
endMonth = input(title="End Month", type=input.integer,
     defval=11, minval=1, maxval=12)
endYear = input(title="End Year", type=input.integer,
     defval=2030, minval=1800, maxval=2100)
// Look if the close time of the current bar
// falls inside the date range
inDateRange =  true

//波段多
if (inDateRange and crossunder(f3,f1))//
    strategy.entry("buy", strategy.long,1, when=macd>0, comment = "買Long-term")
buyclose=crossunder(f3,f5)
strategy.close("buy", when = buyclose, comment = "關Long-term")
//多策略1
if (inDateRange and crossover(low , f3) and macd>0 and f3>f6)
    strategy.entry("buy1", strategy.long,100, comment = "買Mid-term")
buyclose1=crossunder(close,upper*0.999)
if (macd<0 or f3<f6)
    strategy.close("buy1", comment = "關Mid-term")
//strategy.close("buy1",when=cross(basis,close), comment = "關M",qty_percent=50)
strategy.close("buy1", when = buyclose1, comment = "關Mid-term",qty_percent=100)
//多策略3
if (inDateRange and  (macd>0) and crossunder(low,f1) and f1>f4) //
    strategy.entry("buy3", strategy.long,1, comment = "買Short-term")
buyclose3=crossunder(close,upper*0.999)
if (macd<0 or f1<f4)
    strategy.close("buy3", comment = "關Short-term")
strategy.close("buy3", when = buyclose3, comment = "關Short-term")
//多策略4
if (inDateRange and  (macd>0) and crossunder(low,f5) and f4>f5) //
    strategy.entry("buy4", strategy.long,1, comment = "買Long-term")
buyclose4=crossunder(close,upper*0.999)
if (macd<0 or f4<f6)
    strategy.close("buy4", comment = "關Long-term")
strategy.close("buy4", when = buyclose4, comment = "關Long-term")

//空策略1
if (inDateRange and  (macd<0) and crossunder(high,f1) and f1<f3 and f3<f6) //
    strategy.entry("sell1", strategy.short,1, comment = "空Short-term")
sellclose1=crossunder(lower*0.999,close)
if (macd>0 or f1>f4)
    strategy.close("sell1", comment = "關空Short-term")
strategy.close("sell1", when = sellclose1, comment = "關空Short-term")
//空策略2
if (inDateRange and  (macd<0) and crossunder(high,f4) and f4<f6) //
    strategy.entry("sell2", strategy.short,1, comment = "空Mid-term")
sellclose2=crossunder(lower,close)
if (macd>0 or f4>f6)
    strategy.close("sell2", comment = "關空Mid-term")
strategy.close("sell2", when = sellclose2, comment = "關Mid-term")
//空策略3
if (inDateRange and (macd<0) and crossunder(high,f6)) //
    strategy.entry("sell3", strategy.short,1, comment = "空Long-term")
sellclose3=crossunder(lower,close)
if (macd>0 or f6>f7)
    strategy.close("sell3", comment = "關空Long-term")
strategy.close("sell3", when = sellclose3, comment = "關空Long-term")