Estrategia de seguimiento de tendencias basada en el rango verdadero promedio
Descripción general
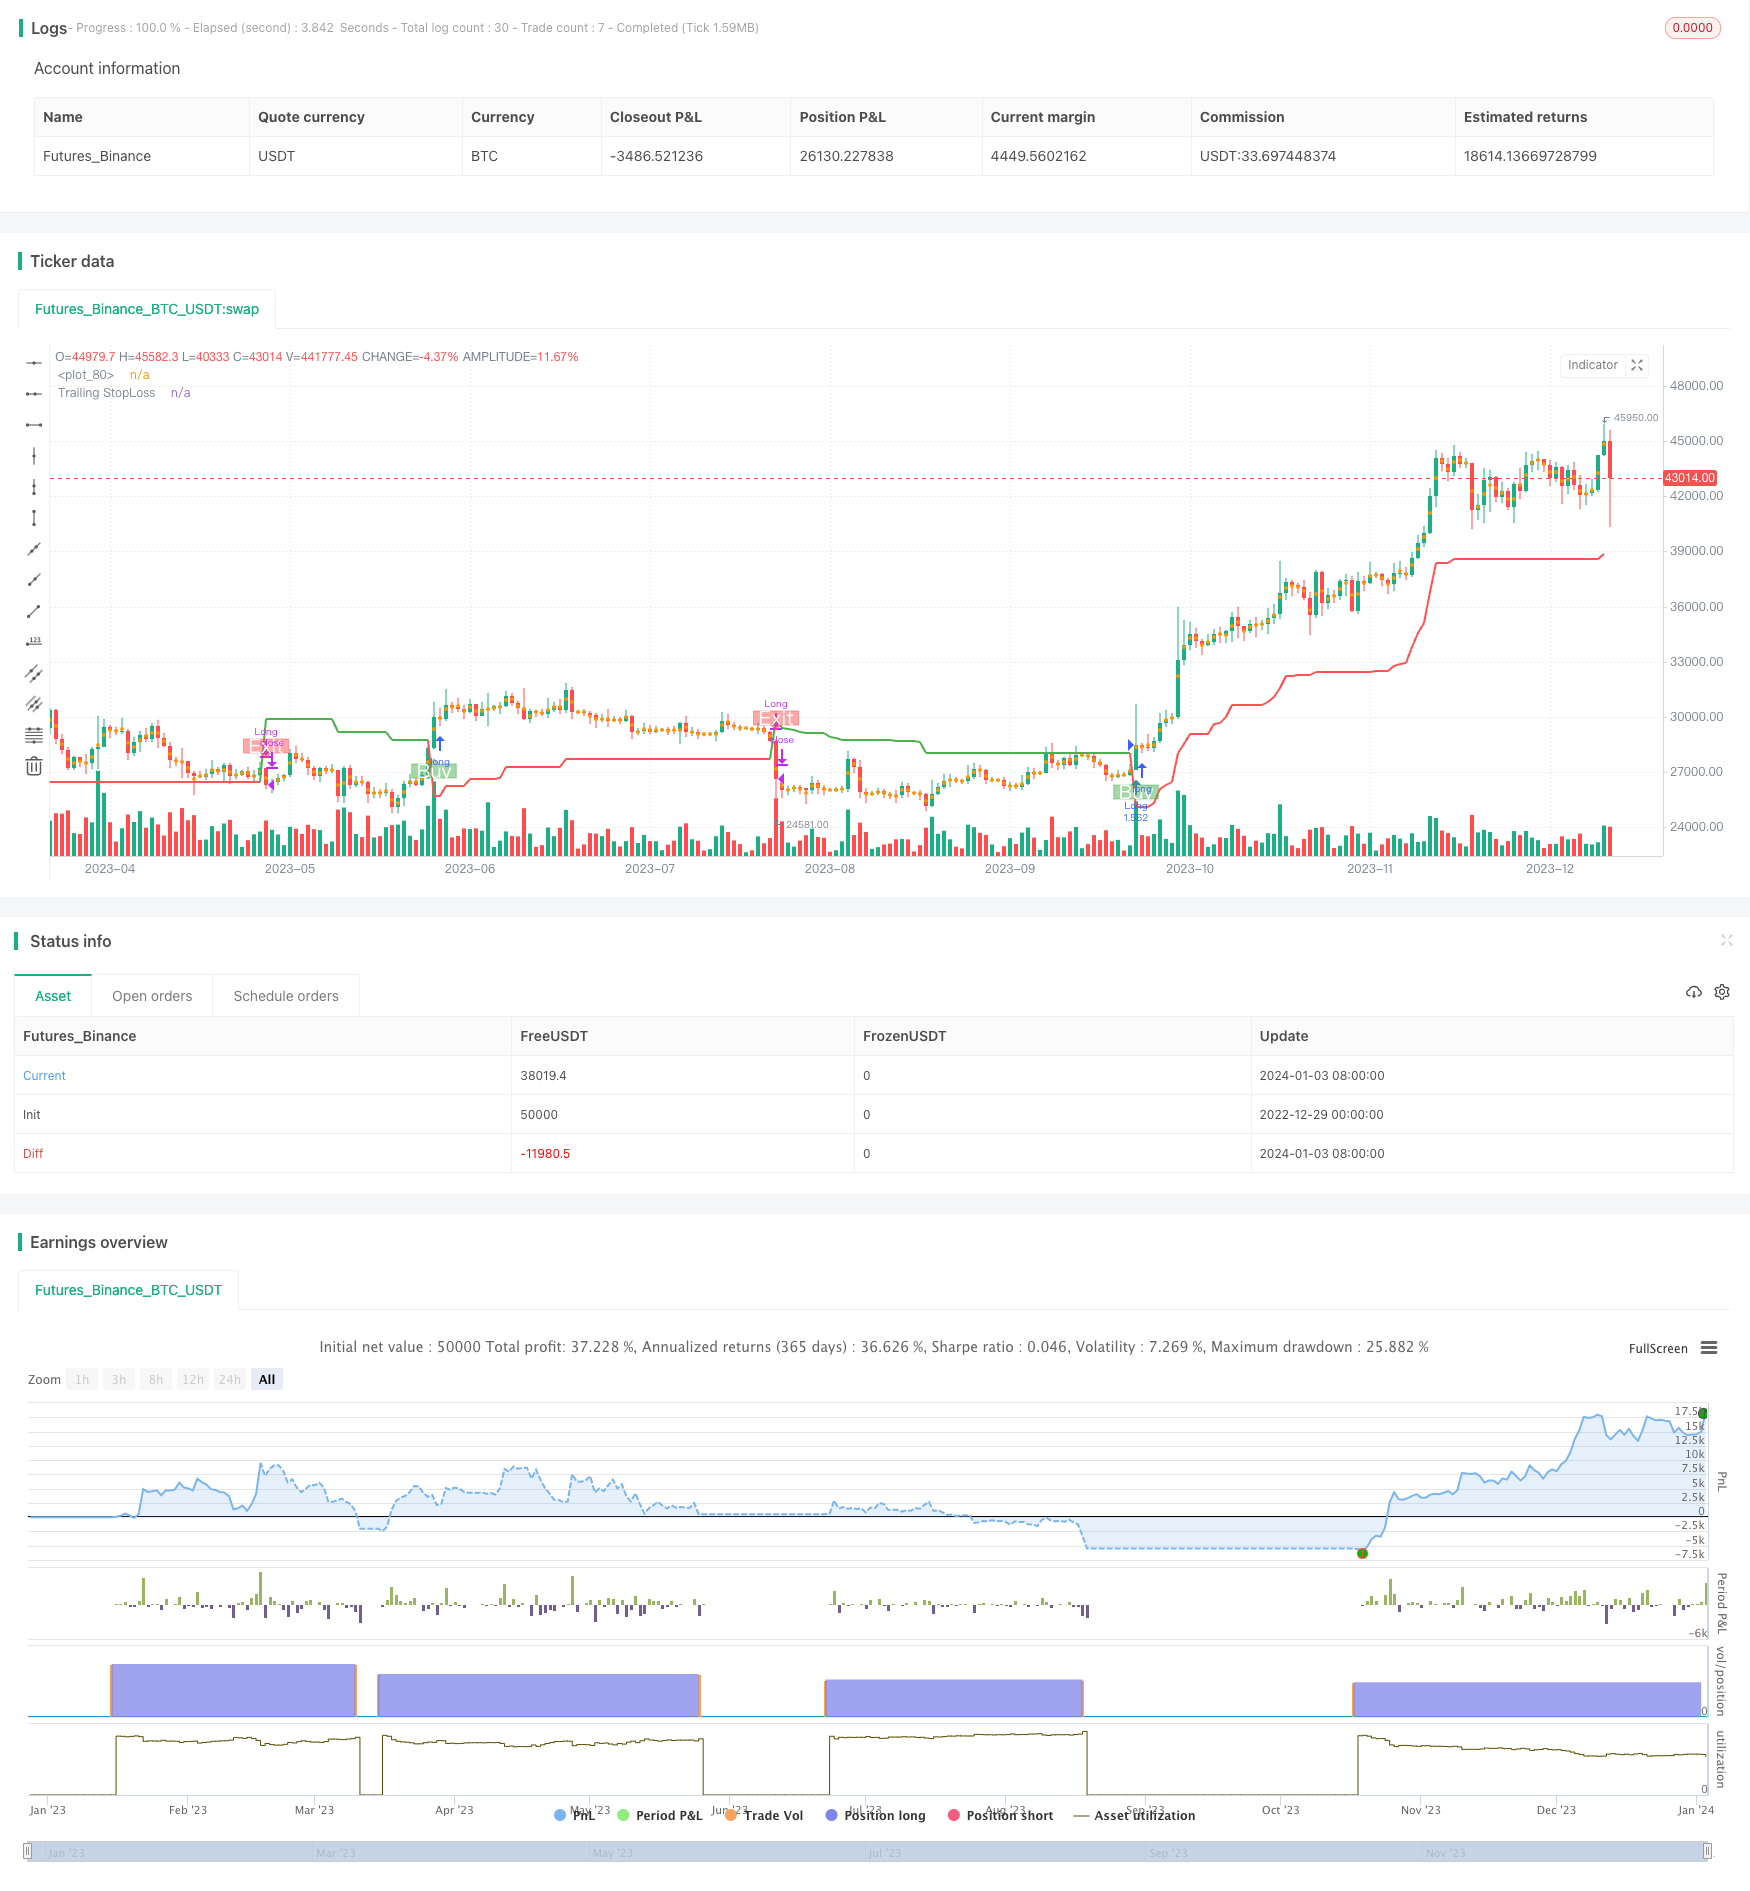
La estrategia es una estrategia de seguimiento de tendencias basado en la amplitud real media (ATR). Utiliza el ATR para calcular el valor del indicador y así determinar la dirección de la tendencia de los precios. La estrategia también ofrece un mecanismo de suspensión de pérdidas para controlar el riesgo.
Principio de estrategia
La estrategia utiliza tres parámetros principales: el período, el multiplicador y el punto de entrada / salida. El parámetro predeterminado es el ATR de 14 ciclos y el multiplicador de 4 veces.
La estrategia comienza por calcular el precio promedio de los bonos (buyavg) y el precio promedio de los bonos (sellavg), y luego compara el precio con la relación entre estos dos precios promedio para determinar la dirección de la tendencia actual. Si el precio es superior al precio promedio de los bonos, se juzga que es un bonos; si el precio es inferior al precio promedio de los bonos, se juzga que es un bonos.
Además, la estrategia se combina con ATR para establecer un trailing stop loss. El método específico es: multiplicar el promedio de movimiento ponderado de 14 ciclos de ATR por un múltiplo (el valor predeterminado es 4) como la distancia de parada. De esta manera, se puede ajustar la distancia de parada según la volatilidad del mercado.
Cuando se activa el stop loss, la estrategia se liquida para obtener ganancias.
Ventajas estratégicas
- Basado en las tendencias, se puede seguir adelante y obtener beneficios sostenidos
- El uso de ATR para ajustar la distancia de frenado de forma dinámica permite un control efectivo del riesgo
- El cálculo de puntos de venta es simple, directo y fácil de entender.
Riesgos y contramedidas
- El cambio de tendencia podría generar mayores pérdidas
- Ajuste adecuado de los ciclos y multiplicadores ATR para optimizar la distancia de parada
- WILL sufrió varias pérdidas menores durante el sismo.
- Aumentar las condiciones de filtración para evitar una caída de mercado
- La configuración incorrecta de los parámetros puede alterar el efecto de la política
- Pruebas de optimización de parámetros de combinación múltiple para encontrar el parámetro óptimo
Dirección de optimización de la estrategia
- Incorporar otros indicadores para evaluar las señales de filtración y evitar la entrada en juego en situaciones de conmoción
- Optimización de los ciclos ATR y los parámetros de multiplicación para hacer que la distancia de parada sea más razonable
- Añadir un control de posiciones abiertas para ajustar el tamaño de las posiciones según las condiciones del mercado
Resumir
La estrategia en su conjunto es una estrategia de seguimiento de tendencias sencilla y práctica. Se puede implementar con solo un pequeño número de parámetros, y se puede ajustar el stop loss dinámicamente a través de ATR para controlar el riesgo de manera efectiva. Si se combina con otros indicadores de juicio auxiliares, se puede optimizar aún más y filtrar algunas señales de ruido. En general, la estrategia es adecuada para aquellos que desean aprender estrategias de seguimiento de tendencias, y también se puede usar como un componente básico de otras estrategias avanzadas.
/*backtest
start: 2022-12-29 00:00:00
end: 2024-01-04 00:00:00
period: 1d
basePeriod: 1h
exchanges: [{"eid":"Futures_Binance","currency":"BTC_USDT"}]
*/

//@version=5
strategy('Trend Strategy by zdmre', shorttitle='Trend Strategy', overlay=true, pyramiding=0, currency=currency.USD, default_qty_type=strategy.percent_of_equity, initial_capital=10000, default_qty_value=100, commission_type=strategy.commission.percent, commission_value=0.005)
show_STOPLOSSprice = input(true, title='Show TrailingSTOP Prices')
src = input(close, title='Source')
out2 = ta.ema(src, 20)

buyavg = (close + high) / 2.02 - high * (1 - open / close) * (1 - low * open / (high * close))
sellavg = ((low + close) / 1.99 + low * (1 - low / open) * (1 - low * open / (close * high)) / 1.1 + out2 )/ 2

// === INPUT BACKTEST RANGE ===
fromMonth = input.int(defval=1, title='From Month', minval=1, maxval=12)
fromDay = input.int(defval=1, title='From Day', minval=1, maxval=31)
fromYear = input.int(defval=2021, title='From Year', minval=1970)
thruMonth = input.int(defval=1, title='Thru Month', minval=1, maxval=12)
thruDay = input.int(defval=1, title='Thru Day', minval=1, maxval=31)
thruYear = input.int(defval=2100, title='Thru Year', minval=1970)

// === INPUT SHOW PLOT ===
showDate = input(defval=true, title='Show Date Range')

// === FUNCTION EXAMPLE ===
start = timestamp(fromYear, fromMonth, fromDay, 00, 00)  // backtest start window
finish = timestamp(thruYear, thruMonth, thruDay, 23, 59)  // backtest finish window
window() => true


// === TRAILING STOP LOSS === //

ATR_Period = input(14)
ATR_Mult = input(4.0)
var float ATR_TrailSL = na
var int pos = na
atr = ta.rma (ta.tr(true), 14)
xATR = ta.atr(ATR_Period)
nLoss = ATR_Mult * xATR

iff_1 = close > nz(ATR_TrailSL[1], 0) ? close - nLoss : close + nLoss
iff_2 = close < nz(ATR_TrailSL[1], 0) and close[1] < nz(ATR_TrailSL[1], 0) ? math.min(nz(ATR_TrailSL[1]), close + nLoss) : iff_1
ATR_TrailSL := close > nz(ATR_TrailSL[1], 0) and close[1] > nz(ATR_TrailSL[1], 0) ? math.max(nz(ATR_TrailSL[1]), close - nLoss) : iff_2

iff_3 = close[1] > nz(ATR_TrailSL[1], 0) and close < nz(ATR_TrailSL[1], 0) ? -1 : nz(pos[1], 0)
pos := close[1] < nz(ATR_TrailSL[1], 0) and close > nz(ATR_TrailSL[1], 0) ? 1 : iff_3

atr_color = pos == -1 ? color.green : pos == 1 ? color.red : color.aqua
atrtrend = plot(ATR_TrailSL, 'Trailing StopLoss', atr_color, linewidth=2)

// ===  Stop Loss === //
slGroup = 'Stop Loss'
useSL = input.bool(false, title='╔══════   Enable   ══════╗', group=slGroup, tooltip='If you are using this strategy for Scalping or Futures market, we do not recommend using Stop Loss.')
SLbased = input.string(title='Based on', defval='Percent', options=['ATR', 'Percent'], group=slGroup, tooltip='ATR: Average True Range\nPercent: eg. 5%.')
multiATR = input.float(10.0, title='ATR   Mult', group=slGroup, inline='atr')
lengthATR = input.int(14, title='Length', group=slGroup, inline='atr')
SLPercent = input.float(5, title='Percent', group=slGroup) * 0.01
Shortposenter = input.bool(false, title='ShortPosition')

longStop = 0.0
shortStop = 0.0

if SLbased == 'ATR'
    longStop := ta.valuewhen(pos == 1, low, 0) - ta.valuewhen(pos == 1, ta.rma(ta.tr(true), lengthATR), 0) * multiATR
    longStopPrev = nz(longStop[1], longStop)
    longStop := close[1] > longStopPrev ? math.max(longStop, longStopPrev) : longStop

    shortStop := ta.valuewhen(pos == -1, ta.rma(ta.tr(true), lengthATR), 0) * multiATR + ta.valuewhen(pos == -1, high, 0)
    shortStopPrev = nz(shortStop[1], shortStop)
    shortStop := close[1] > shortStopPrev ? math.max(shortStop, shortStopPrev) : shortStop
    shortStop
if SLbased == 'Percent'
    longStop := strategy.position_avg_price * (1 - SLPercent)
    shortStop := strategy.position_avg_price * (1 + SLPercent)
    shortStop
exitLong  = pos == -1

// === PlotColor === //
buySignal = pos == 1 and pos[1] == -1
plotshape(buySignal, title="Long", location=location.belowbar, style=shape.labelup, size=size.normal, color=color.new(color.green,50), text='Buy', textcolor=color.white)
exitSignal = pos == -1 and pos[1] == 1
plotshape(exitSignal, title="Exit", location=location.abovebar, style=shape.labeldown, size=size.normal, color=color.new(color.red,50), text='Exit', textcolor=color.white)

hPlot = plot(ohlc4, title="", style=plot.style_circles, linewidth=0, editable = false)
longFill = (pos == 1 ? color.new(color.green,80) : na)
shortFill = (pos == -1 ? color.new(color.red,80) : na)
fill(hPlot, atrtrend,color=longFill)
fill(hPlot,atrtrend, color=shortFill)

// === Strategy === //
strategy.entry('Long', strategy.long,limit = buyavg, when=window() and pos == 1,comment="Entry: "+str.tostring(buyavg))
strategy.close('Long', when=window() and exitLong , comment='Exit: '+str.tostring(sellavg) )

if Shortposenter
    strategy.entry('Short', strategy.short, when=window() and pos== -1,comment="Entry: "+str.tostring(close))
    strategy.close('Short', when=window() and pos == 1 , comment='Exit: ')

if useSL
    strategy.exit('Stop Loss', 'Long', stop=longStop)

// === Show StopLoss Price === //
if show_STOPLOSSprice
    if pos == -1
        label ShortStop = label.new(bar_index, na, 'SL: ' + str.tostring(ATR_TrailSL), color=color.green, textcolor=color.white, style=label.style_none, yloc=yloc.abovebar, size=size.small)
        label.delete(ShortStop[1])

    if pos == 1
        label LongStop = label.new(bar_index, na, 'SL: ' + str.tostring(ATR_TrailSL), color=color.red, textcolor=color.white, style=label.style_none, yloc=yloc.belowbar, size=size.small)
        label.delete(LongStop[1])