Estrategia de trading adaptativa basada en el indicador ADX
Descripción general
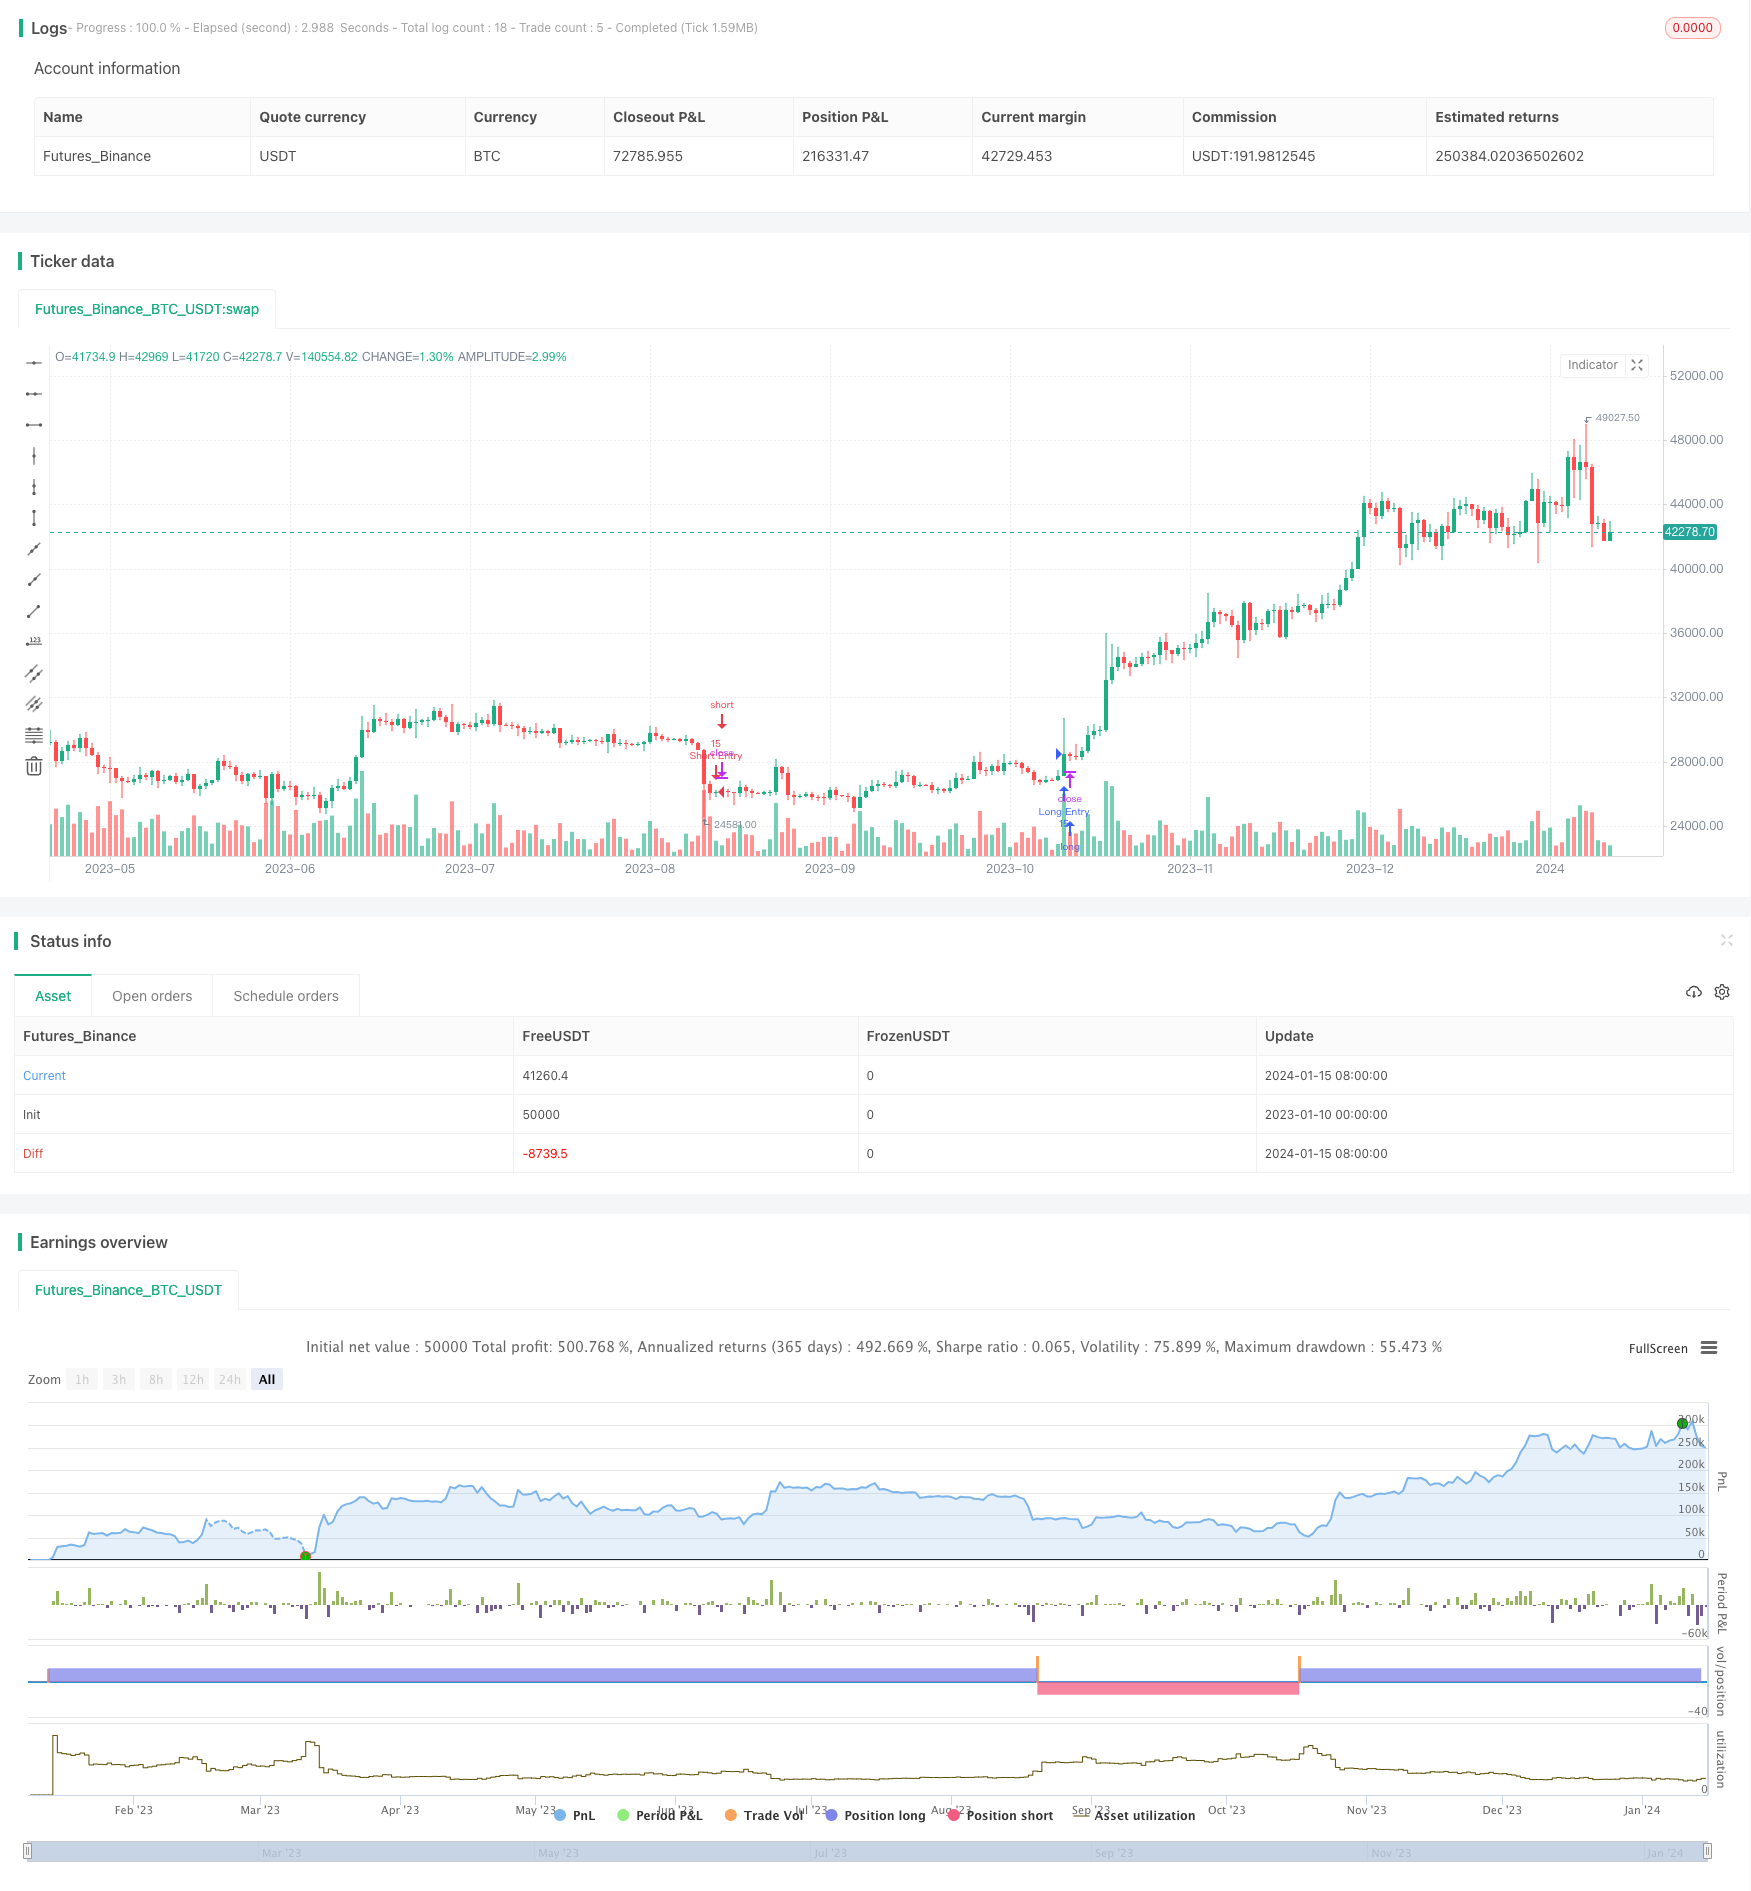
El núcleo de esta estrategia es el uso de indicadores ADX para juzgar las tendencias del mercado, y en combinación con el DI+-indicador de diferenciación de los puntos de ruptura de identificación automática, para que el comercio de auto-adaptación. Cuando el DI+ y ADX de diferenciación supera el umbral establecido, hacer más, y cuando el DI- y ADX de diferenciación supera el umbral establecido, hacer nada. La estrategia puede identificar automáticamente los puntos de ruptura de la tendencia, sin necesidad de intervención humana, adecuado para la línea media de largo.
Principio de estrategia
Calcule el rango verdadero, el movimiento direccional, y obtenga los indicadores DI+, DI- y DX.
Compara la amplitud de diferencia de DI+ con la de ADX1, y la amplitud de diferencia de DI- con la de ADX2.
Cuando la amplitud 1 es mayor que el umbral de ajuste (por ejemplo, 10), se genera una señal de multitarea; cuando la amplitud 2 es mayor que el umbral de ajuste (por ejemplo, 10), se genera una señal de vacío.
Se requiere que el ADX se interponga entre el DI+ y el DI- para filtrar las señales erróneas.
De esta manera, cuando el mercado entra en una tendencia, DI+ o DI- se adelanta claramente al ADX, lo que genera una señal de negociación; cuando el mercado se cierra, DI+, DI- y ADX vuelven a acercarse, evitando perseguir los altibajos.
Ventajas estratégicas
El sistema automático reconoce los puntos de ruptura de tendencias sin necesidad de un juicio humano.
La diferencia entre el DI y el ADX se puede ajustar con flexibilidad para adaptarse a diferentes condiciones de mercado.
En combinación con el indicador ADX, se puede filtrar eficazmente las señales erróneas.
El tiempo de tenencia de acciones es más largo, no se requiere una alta frecuencia de transacciones, y el uso de fondos es alto.
El retiro es controlado, el crecimiento es estable.
Riesgo estratégico
El indicador ADX está atrasado y puede perder oportunidades de negociación en líneas cortas. Se puede combinar con otros indicadores o reducir los parámetros ADX para aumentar la sensibilidad.
En situaciones convulsivas, es fácil que se corra. Se puede introducir una estrategia de stop loss o agregar condiciones de filtración ADX para reducir la probabilidad de corta.
El riesgo de pérdidas es muy alto cuando hay una reversión de tendencia significativa. Se puede configurar un stop móvil o un stop de seguimiento para controlar el riesgo.
Optimización de la estrategia
Se pueden probar diferentes mercados y variedades para ajustar la mejor combinación de parámetros.
Se puede considerar la combinación de otros indicadores para mejorar la precisión de la señal, como MACD, KD, etc.
Aumentar las estrategias de stop loss para controlar la retirada y la máxima pérdida.
Introducción de la gestión de posiciones para ajustar las posiciones de negociación según las condiciones del mercado.
Optimizar la selección de puntos de entrada y salida para reducir el riesgo de transacción.
Resumir
Esta estrategia integra las ventajas de los indicadores ADX y DI, permite un juicio efectivo de las tendencias y el comercio de adaptación. No se requiere un manejo frecuente, adecuado para la línea media y larga.
/*backtest
start: 2023-01-10 00:00:00
end: 2024-01-16 00:00:00
period: 1d
basePeriod: 1h
exchanges: [{"eid":"Futures_Binance","currency":"BTC_USDT"}]
*/

// This source code is subject to the terms of the Mozilla Public License 2.0 at https://mozilla.org/MPL/2.0/
// © MAURYA_ALGO_TRADER

//@version=5
strategy("Monthly Performance by Dr. Maurya", overlay=true, default_qty_value = 15, commission_type = strategy.commission.percent, commission_value = 0.1)


len = input(14)
th = input(20)

TrueRange = math.max(math.max(high - low, math.abs(high - nz(close[1]))), math.abs(low - nz(close[1])))
DirectionalMovementPlus = high - nz(high[1]) > nz(low[1]) - low ? math.max(high - nz(high[1]), 0) : 0
DirectionalMovementMinus = nz(low[1]) - low > high - nz(high[1]) ? math.max(nz(low[1]) - low, 0) : 0

SmoothedTrueRange = 0.0
SmoothedTrueRange := nz(SmoothedTrueRange[1]) - nz(SmoothedTrueRange[1]) / len + TrueRange

SmoothedDirectionalMovementPlus = 0.0
SmoothedDirectionalMovementPlus := nz(SmoothedDirectionalMovementPlus[1]) - nz(SmoothedDirectionalMovementPlus[1]) / len + DirectionalMovementPlus

SmoothedDirectionalMovementMinus = 0.0
SmoothedDirectionalMovementMinus := nz(SmoothedDirectionalMovementMinus[1]) - nz(SmoothedDirectionalMovementMinus[1]) / len + DirectionalMovementMinus

DIPlus = SmoothedDirectionalMovementPlus / SmoothedTrueRange * 100
DIMinus = SmoothedDirectionalMovementMinus / SmoothedTrueRange * 100
DX = math.abs(DIPlus - DIMinus) / (DIPlus + DIMinus) * 100
ADX = ta.sma(DX, len)


//diff_1 = math.abs(DIPlus - DIMinus)
diff_2 = math.abs(DIPlus-ADX)
diff_3 = math.abs(DIMinus - ADX)

long_diff = input(10, "Long Difference")
short_diff = input(10, "Short Difference")

buy_condition = diff_2 >=long_diff and diff_3 >=long_diff and (ADX < DIPlus and ADX > DIMinus)
sell_condition = diff_2 >=short_diff and diff_3 >=short_diff and (ADX > DIPlus and ADX < DIMinus)


if buy_condition
    strategy.entry("Long Entry", strategy.long, comment = "Long")
if sell_condition
    strategy.entry("Short Entry", strategy.short, comment = "Short")


// Copy below code to end of the desired strategy script
///////////////////////////////////////////////////////////////////////////////////////////////////////////////////////
//                                 monthly pnl performance  by Dr. Maurya @MAURYA_ALGO_TRADER                        //
///////////////////////////////////////////////////////////////////////////////////////////////////////////////////////
show_performance = input.bool(true, 'Show Monthly Monthly Performance ?', group='Monthly Performance')

dash_loc_mp = input("Bottom Right","Location"  ,options=["Top Right","Bottom Right","Top Left","Bottom Left", "Middle Right","Bottom Center"]  ,group='Monthly Performance', inline = "performance")

text_size_mp = input('Small',"Size"  ,options=["Tiny","Small","Normal","Large"]  ,group='Monthly Performance', inline = "performance")

bg_c = input.color( color.rgb(7, 226, 242, 38), "Background Color", group='Monthly Performance')

text_head_color = input.color( color.rgb(0,0,0), "Month/Year Heading Color", group='Monthly Performance')

tab_month_c = input.color( color.white, "Month PnL Data Color", group='Monthly Performance')

tab_year_c = input.color( color.rgb(0,0,0), "Year PnL Data Color", group='Monthly Performance')

border_c = input.color( color.white, "Table Border Color", group='Monthly Performance')


var table_position_mp = dash_loc_mp == 'Top Left' ? position.top_left :
  dash_loc_mp == 'Bottom Left' ? position.bottom_left :
  dash_loc_mp == 'Middle Right' ? position.middle_right :
  dash_loc_mp == 'Bottom Center' ? position.bottom_center :
  dash_loc_mp == 'Top Right' ? position.top_right : position.bottom_right

var table_text_size_mp = text_size_mp == 'Tiny' ? size.tiny :
  text_size_mp == 'Small' ? size.small :
  text_size_mp == 'Normal' ? size.normal : size.large

/////////////////
strategy.initial_capital =50000

/////////////////////////////////////////////

// var bool new_month = na
new_month = ta.change(month) //> 0 ? true : false
newest_month = new_month and strategy.closedtrades >= 1

// profit
only_profit = strategy.netprofit
initial_balance = strategy.initial_capital

// month number
var int month_number = na
month_number := (ta.valuewhen(newest_month, month(time), 0)) //and month(time) > 1 ? (ta.valuewhen(newest_month, month(time), 0) - 1) :  12 //1 to 12

//month_year
var int month_time = na
month_time := ta.valuewhen(newest_month, time, 0) - 2419200000


var int m_counter = 0
if newest_month
    m_counter += 1


// current month values
var bool new_year = na
new_year := ta.change(year)
curr_m_pnl = only_profit - nz(ta.valuewhen(newest_month, only_profit, 0), 0)
curr_m_number = newest_month ? ta.valuewhen(newest_month, month(time), 0) : month(time)
curr_y_pnl = (only_profit - nz(ta.valuewhen(new_year, only_profit, 0),0))


var float [] net_profit_array = array.new_float()
var int [] month_array = array.new_int()
var int [] month_time_array = array.new_int()


if newest_month
    array.push(net_profit_array, only_profit)
    array.push(month_array, month_number)
    array.push(month_time_array, month_time)


var float [] y_pnl_array = array.new_float()
var int [] y_number_array = array.new_int()
var int [] y_time_array = array.new_int()

newest_year = ta.change(year) and strategy.closedtrades >= 1
get_yearly_pnl = nz(ta.valuewhen(newest_year, strategy.netprofit, 0) - nz(ta.valuewhen(newest_year, strategy.netprofit, 1), 0), 0)
get_m_year = ta.valuewhen(newest_year, year(time), 1)
get_y_time = ta.valuewhen(newest_year, time, 0)

if newest_year
    array.push(y_pnl_array, get_yearly_pnl)
    array.push(y_number_array, get_m_year)
    array.push(y_time_array, get_y_time)
var float monthly_profit = na
var int column_month_number = na
var int row_month_time = na


var testTable = table.new(position = table_position_mp, columns = 14, rows = 40, bgcolor = bg_c, border_color = border_c, border_width = 1)
if barstate.islastconfirmedhistory and show_performance
    table.cell(table_id = testTable, column = 0, row = 0, text = "YEAR", text_color = text_head_color, text_size=table_text_size_mp)
    table.cell(table_id = testTable, column = 1, row = 0, text = "JAN", text_color = text_head_color, text_size=table_text_size_mp)
    table.cell(table_id = testTable, column = 2, row = 0, text = "FEB", text_color = text_head_color, text_size=table_text_size_mp)
    table.cell(table_id = testTable, column = 3, row = 0, text = "MAR", text_color = text_head_color, text_size=table_text_size_mp)
    table.cell(table_id = testTable, column = 4, row = 0, text = "APR", text_color = text_head_color, text_size=table_text_size_mp)
    table.cell(table_id = testTable, column = 5, row = 0, text = "MAY", text_color = text_head_color, text_size=table_text_size_mp)
    table.cell(table_id = testTable, column = 6, row = 0, text = "JUN", text_color = text_head_color, text_size=table_text_size_mp)
    table.cell(table_id = testTable, column = 7, row = 0, text = "JUL", text_color = text_head_color, text_size=table_text_size_mp)
    table.cell(table_id = testTable, column = 8, row = 0, text = "AUG", text_color = text_head_color, text_size=table_text_size_mp)
    table.cell(table_id = testTable, column = 9, row = 0, text = "SEP", text_color = text_head_color, text_size=table_text_size_mp)
    table.cell(table_id = testTable, column = 10, row = 0, text = "OCT", text_color = text_head_color, text_size=table_text_size_mp)
    table.cell(table_id = testTable, column = 11, row = 0, text = "NOV", text_color = text_head_color, text_size=table_text_size_mp)
    table.cell(table_id = testTable, column = 12, row = 0, text = "DEC", text_color =text_head_color, text_size=table_text_size_mp)
    table.cell(table_id = testTable, column = 13, row = 0, text = "YEAR P/L", text_color = text_head_color, text_size=table_text_size_mp)

    for i = 0 to (array.size(y_number_array) == 0 ? na : array.size(y_number_array) - 1)
        row_y = year(array.get(y_time_array, i)) - year(array.get(y_time_array, 0)) + 1
        table.cell(table_id = testTable, column = 13, row = row_y, text = str.tostring(array.get(y_pnl_array , i), "##.##") + '\n' + '(' + str.tostring(array.get(y_pnl_array , i)*100/initial_balance, "##.##") + ' %)', bgcolor = array.get(y_pnl_array , i) > 0 ? color.green : array.get(y_pnl_array , i) < 0 ? color.red : color.gray, text_color = tab_year_c, text_size=table_text_size_mp)
    curr_row_y = array.size(month_time_array) == 0 ? 1 : (year(array.get(month_time_array, array.size(month_time_array) - 1))) - (year(array.get(month_time_array, 0))) + 1
    table.cell(table_id = testTable, column = 13, row = curr_row_y, text = str.tostring(curr_y_pnl, "##.##") + '\n' + '(' + str.tostring(curr_y_pnl*100/initial_balance, "##.##") + ' %)', bgcolor = curr_y_pnl > 0 ? color.green : curr_y_pnl < 0 ? color.red : color.gray, text_color = tab_year_c, text_size=table_text_size_mp)


    for i = 0 to (array.size(net_profit_array) == 0 ? na : array.size(net_profit_array) - 1)
        monthly_profit := i > 0 ? ( array.get(net_profit_array, i) - array.get(net_profit_array, i - 1) ) : array.get(net_profit_array, i)
        column_month_number := month(array.get(month_time_array, i))
        row_month_time :=((year(array.get(month_time_array, i))) - year(array.get(month_time_array, 0)) ) + 1
        table.cell(table_id = testTable, column = column_month_number, row = row_month_time, text = str.tostring(monthly_profit, "##.##") + '\n' + '(' + str.tostring(monthly_profit*100/initial_balance, "##.##") + ' %)', bgcolor = monthly_profit > 0 ? color.green : monthly_profit < 0 ? color.red : color.gray, text_color = tab_month_c, text_size=table_text_size_mp)
        table.cell(table_id = testTable, column = 0, row =row_month_time, text = str.tostring(year(array.get(month_time_array, i)), "##.##"), text_color = text_head_color, text_size=table_text_size_mp)

    curr_row_m = array.size(month_time_array) == 0 ? 1 : (year(array.get(month_time_array, array.size(month_time_array) - 1))) - (year(array.get(month_time_array, 0))) + 1
    table.cell(table_id = testTable, column = curr_m_number, row = curr_row_m, text = str.tostring(curr_m_pnl, "##.##") + '\n' + '(' + str.tostring(curr_m_pnl*100/initial_balance, "##.##") + ' %)', bgcolor = curr_m_pnl > 0 ? color.green : curr_m_pnl < 0 ? color.red : color.gray, text_color = tab_month_c, text_size=table_text_size_mp)
    table.cell(table_id = testTable, column = 0, row =curr_row_m, text = str.tostring(year(time), "##.##"), text_color = text_head_color, text_size=table_text_size_mp)

//============================================================================================================================================================================