Estrategia de seguimiento de tendencia con trailing stop adaptativo basada en ATR y RSI
Descripción general
La estrategia combina el uso de un rango de fluctuación real promedio (ATR), un índice de fuerza relativa (RSI) y un stop loss móvil para lograr un seguimiento de tendencias adaptativo. Calcula el stop loss dinámico a través del ATR, utiliza el RSI para determinar la dirección de la tendencia del mercado, y el stop loss móvil sigue la fluctuación de los precios para maximizar las ganancias. Esta es una estrategia de seguimiento de tendencias muy típica.
Principio de estrategia
El ATR refleja la volatilidad del mercado y el nivel de riesgo. Esta estrategia calcula el nivel de stop loss dinámico a través del ATR para lograr un stop loss adaptativo.
Calcular el RSI. El RSI puede determinar el exceso de compra y venta en el mercado. Cuando el RSI es mayor que 50 es un alza y menor que 50 es una baja. Esta estrategia utiliza el RSI para determinar la dirección de la tendencia de los precios.
El seguimiento de los paros móviles. Esta estrategia permite que los paros móviles sigan las fluctuaciones de los precios de acuerdo con la dirección de la tendencia de los paros calculados por el ATR y el RSI, aumentando gradualmente los paros para maximizar las ganancias al mismo tiempo que garantiza los paros.
En concreto, cuando el RSI es mayor que 50 para abrir una posición de sobreposición y menor que 50 para abrir una posición de vacío. Después de utilizar el precio de parada de pérdida calculado por el ATR para mover la parada de pérdida y seguir la fluctuación de los precios.
Análisis de las ventajas
El uso de ATR para lograr un alto de pérdidas adaptativo permite ajustar el alto de pérdidas en función de la dinámica de la volatilidad del mercado, evitando que el alto de pérdidas sea demasiado pequeño.
El RSI es un indicador de tendencia que es preciso y fiable para evitar que las transacciones se queden atrapadas en mercados inestables.
El Stop Loss móvil rastrea la fluctuación de los precios, lo que permite ampliar el Stop Loss y seguir la tendencia para obtener beneficios.
Análisis de riesgos
Las configuraciones de los parámetros ATR y RSI deben ser optimizadas mediante retroalimentación, de lo contrario afectarán la eficacia de la estrategia.
A pesar de la protección contra pérdidas, es difícil evitar el riesgo de que se rompa el parón. Se puede reducir la posición adecuadamente para controlar el riesgo.
La estrategia depende mucho de la optimización de los parámetros de las variedades de comercio, lo que requiere ajustar los parámetros para diferentes variedades.
Dirección de optimización
Se puede considerar la inclusión de algoritmos de aprendizaje automático para la optimización de la adaptación de los parámetros.
Se añade un módulo de control de posiciones que permite ajustar el tamaño de las posiciones de forma dinámica en función de las condiciones del mercado, reduciendo la probabilidad de que se rompa el límite de pérdidas.
Aumentar los indicadores de tendencia para evitar pérdidas si se pierde el punto de inflexión.
Resumir
Esta estrategia integra módulos como el uso de ATR, RSI y stop loss móvil, formando una estrategia de seguimiento de tendencias auto-adaptativa típica. La optimización de parámetros permite una gran flexibilidad para adaptarse a las diferentes variedades de operaciones, y es una estrategia de seguimiento de tendencias genérica que vale la pena. La eficacia de esta estrategia se puede mejorar aún más al agregar más criterios de indicadores y optimización de algoritmos de aprendizaje automático.
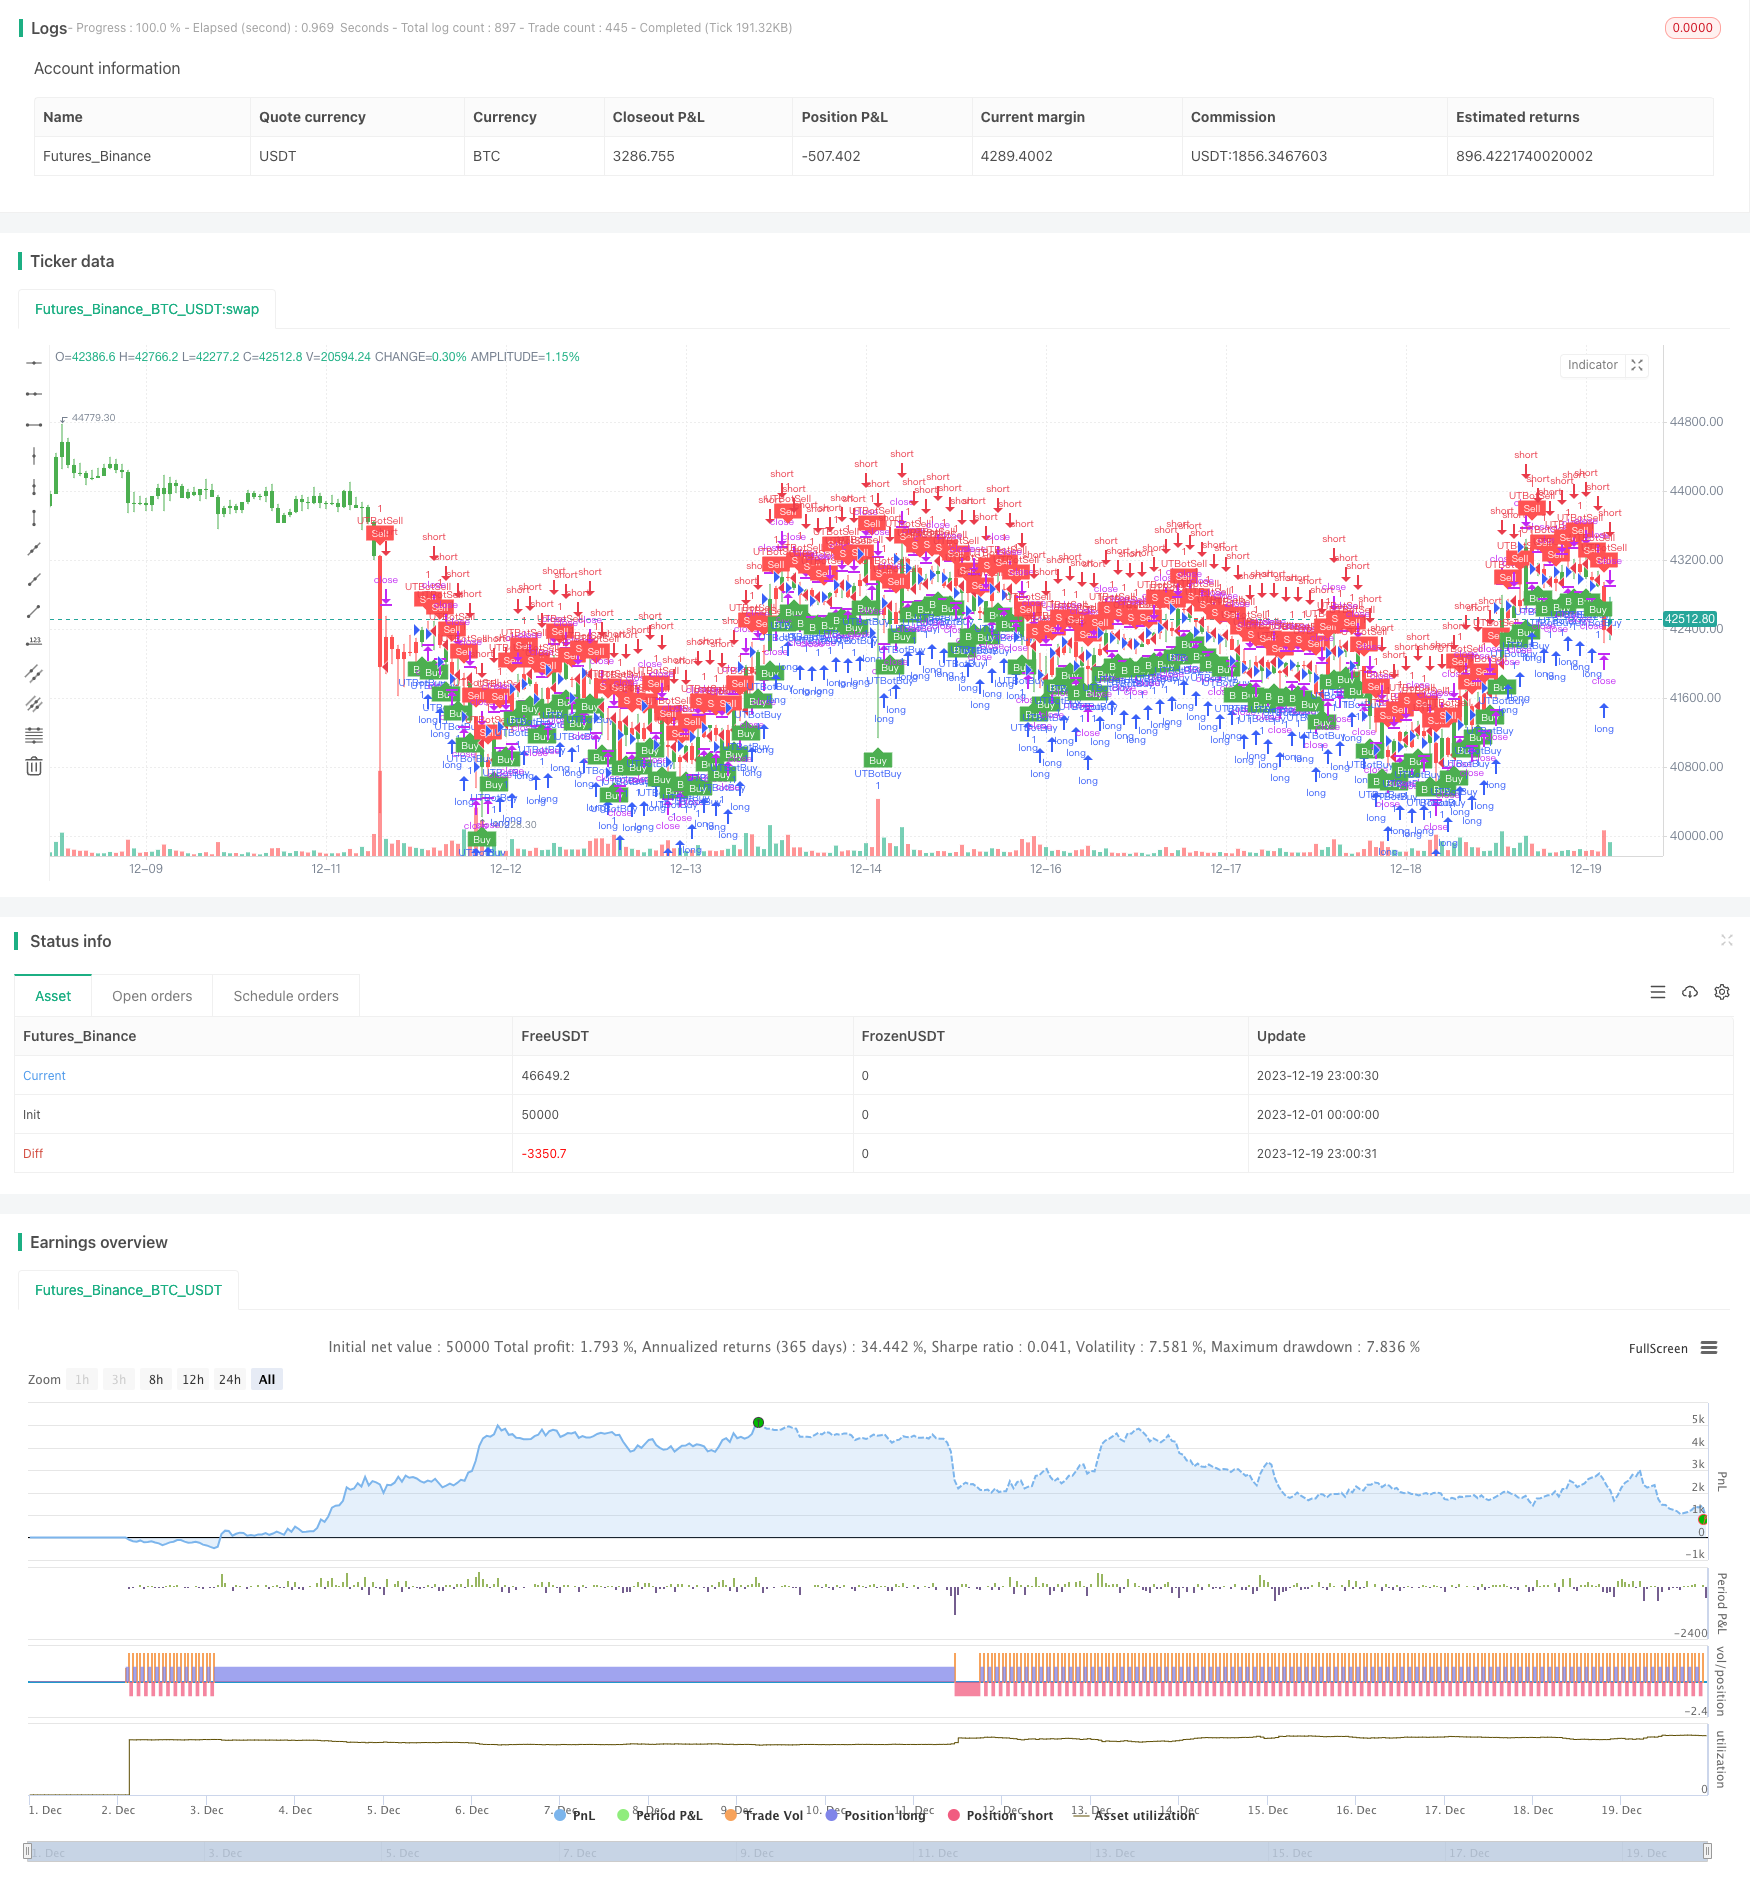
/*backtest
start: 2023-12-01 00:00:00
end: 2023-12-19 23:59:59
period: 1h
basePeriod: 15m
exchanges: [{"eid":"Futures_Binance","currency":"BTC_USDT"}]
*/

//@version=2
strategy(title="UTBot Strategy", overlay = true )

// CREDITS to @HPotter for the orginal code.
// CREDITS to @Yo_adriiiiaan for recently publishing the UT Bot study based on the original code -
// CREDITS to @TradersAITradingPlans for making this Strategy.
// Strategy fixed with Time period by Kirk65.
// I am using this UT bot with 2 hours time frame with god resultss. Alert with "Once per bar" and stoploss 1.5%. If Alerts triggered and price goes against Alert. Stoploss will catch it. Wait until next Alert.
// While @Yo_adriiiiaan mentions it works best on a 4-hour timeframe or above, witch is a lot less risky, but less profitable.

testStartYear = input(2019, "BACKTEST START YEAR", minval = 1980, maxval = 2222)
testStartMonth = input(01, "BACKTEST START MONTH", minval = 1, maxval = 12)
testStartDay = input(01, "BACKTEST START DAY", minval = 1, maxval = 31)
testPeriodStart = timestamp(testStartYear,testStartMonth,testStartDay,0,0)
testStopYear = input(2222, "BACKTEST STOP YEAR", minval=1980, maxval = 2222)
testStopMonth = input(12, "BACKTEST STOP MONTH", minval=1, maxval=12)
testStopDay = input(31, "BACKTEST STOP DAY", minval=1, maxval=31)
testPeriodStop = timestamp(testStopYear, testStopMonth, testStopDay, 0, 0)

testPeriod = true

SOURCE = input(hlc3)
RSILENGTH = input(14, title = "RSI LENGTH")
RSICENTERLINE = input(52, title = "RSI CENTER LINE")
MACDFASTLENGTH = input(7, title = "MACD FAST LENGTH")
MACDSLOWLENGTH = input(12, title = "MACD SLOW LENGTH")
MACDSIGNALSMOOTHING = input(12, title = "MACD SIGNAL SMOOTHING")
a = input(10, title = "Key Vaule. 'This changes the sensitivity'")
SmoothK = input(3)
SmoothD = input(3)
LengthRSI = input(14)
LengthStoch = input(14)
RSISource = input(close)
c = input(10, title="ATR Period")
xATR = atr(c)
nLoss = a * xATR
xATRTrailingStop = iff(close > nz(xATRTrailingStop[1], 0) and close[1] > nz(xATRTrailingStop[1], 0), max(nz(xATRTrailingStop[1]), close - nLoss),
     iff(close < nz(xATRTrailingStop[1], 0) and close[1] < nz(xATRTrailingStop[1], 0), min(nz(xATRTrailingStop[1]), close + nLoss),
     iff(close > nz(xATRTrailingStop[1], 0), close - nLoss, close + nLoss)))
pos =	iff(close[1] < nz(xATRTrailingStop[1], 0) and close > nz(xATRTrailingStop[1], 0), 1,
     iff(close[1] > nz(xATRTrailingStop[1], 0) and close < nz(xATRTrailingStop[1], 0), -1, nz(pos[1], 0)))
color = pos == -1 ? red: pos == 1 ? green : blue
ema= ema(close,1)
above = crossover(ema,xATRTrailingStop )
below = crossover(xATRTrailingStop,ema)
buy = close > xATRTrailingStop and above
sell = close < xATRTrailingStop and below
barbuy = close > xATRTrailingStop
barsell = close < xATRTrailingStop
plotshape(buy, title = "Buy", text = 'Buy', style = shape.labelup, location = location.belowbar, color= green,textcolor = white, transp = 0, size = size.tiny)
plotshape(sell, title = "Sell", text = 'Sell', style = shape.labeldown, location = location.abovebar, color= red,textcolor = white, transp = 0, size = size.tiny)
barcolor(barbuy? green:na)
barcolor(barsell? red:na)
//alertcondition(buy, title='Buy', message='Buy')
//alertcondition(sell, title='Sell', message='Sell')

if (buy)
    strategy.entry("UTBotBuy",strategy.long, when=testPeriod)
if (sell)
    strategy.entry("UTBotSell",strategy.short, when=testPeriod)