Stratégie Super Momentum

Aperçu
La stratégie de super dynamique utilise plusieurs indicateurs dynamiques pour effectuer des opérations d'achat ou de vente lorsque plusieurs indicateurs dynamiques sont en hausse ou en baisse simultanément. La stratégie permet de capturer plus précisément les tendances des prix en combinant plusieurs indicateurs dynamiques et en évitant les signaux erronés causés par un seul indicateur.
Principe de stratégie
La stratégie utilise simultanément 4 RMI d'Everget et 1 CHANDE MO pour calculer la dynamique des prix. L'indicateur RMI est basé sur le calcul de la dynamique des prix, permettant de juger de la force des hausses et des baisses des prix.
L'opération d'achat s'effectue lorsque le RMI5 traverse sa ligne d'achat, le RMI4 sa ligne d'achat, le RMI3 sa ligne d'achat, le RMI2 sa ligne d'achat, le RMI1 sa ligne d'achat et le Chande MO sa ligne d'achat.
L'opération de vente est effectuée lorsque le RMI5 traverse sa ligne de vente, que le RMI4 traverse sa ligne de vente, que le RMI3 traverse sa ligne de vente, que le RMI2 traverse sa ligne de vente, que le RMI1 traverse sa ligne de vente et que le Chande MO traverse sa ligne de vente.
Le RMI5 est réglé dans la direction opposée à celle des autres indicateurs RMI, ce qui permet de mieux identifier les tendances et d'effectuer des opérations pyramidales.
Analyse des avantages
-
L'intégration de plusieurs indicateurs permet de juger les tendances avec plus de précision et d'éviter les faux signaux d'un seul indicateur
-
Il contient des indicateurs à plusieurs périodes permettant d'identifier les tendances à plus grande échelle.
-
L'indicateur RMI inverse peut aider à identifier les tendances et à faire fonctionner la pyramide
-
Chande MO aide à éviter les erreurs de transaction lors d'une survente
Analyse des risques
-
Trop de combinaisons d'indicateurs et de paramètres complexes qui nécessitent un test minutieux et une optimisation
-
Il peut y avoir des signaux erronés lorsque plusieurs indicateurs changent simultanément.
-
La fréquence des transactions pourrait être plus faible si l'on prend en compte plusieurs indicateurs.
-
La nécessité de se concentrer sur l'adéquation des paramètres de l'indicateur aux différentes variétés et conditions du marché
Direction d'optimisation
-
Sélectionnez les paramètres de l'indicateur de test et optimisez-les pour améliorer la stabilité de la stratégie
-
Essayez d'augmenter ou de diminuer certains indicateurs pour évaluer les effets sur la qualité du signal
-
Des conditions de filtrage peuvent être introduites pour éviter des signaux erronés dans des situations spécifiques du marché.
-
Ajuster la position de la ligne d'achat et de vente de l'indicateur pour trouver la combinaison optimale de paramètres
-
Considérer l'inclusion d'un mécanisme de prévention des pertes pour maîtriser les risques
Résumer
Cette stratégie améliore la capacité de discernement des tendances du marché en utilisant de multiples indicateurs dynamiques. Cependant, les paramètres sont complexes et doivent être soigneusement testés et optimisés, améliorés et ajustés.
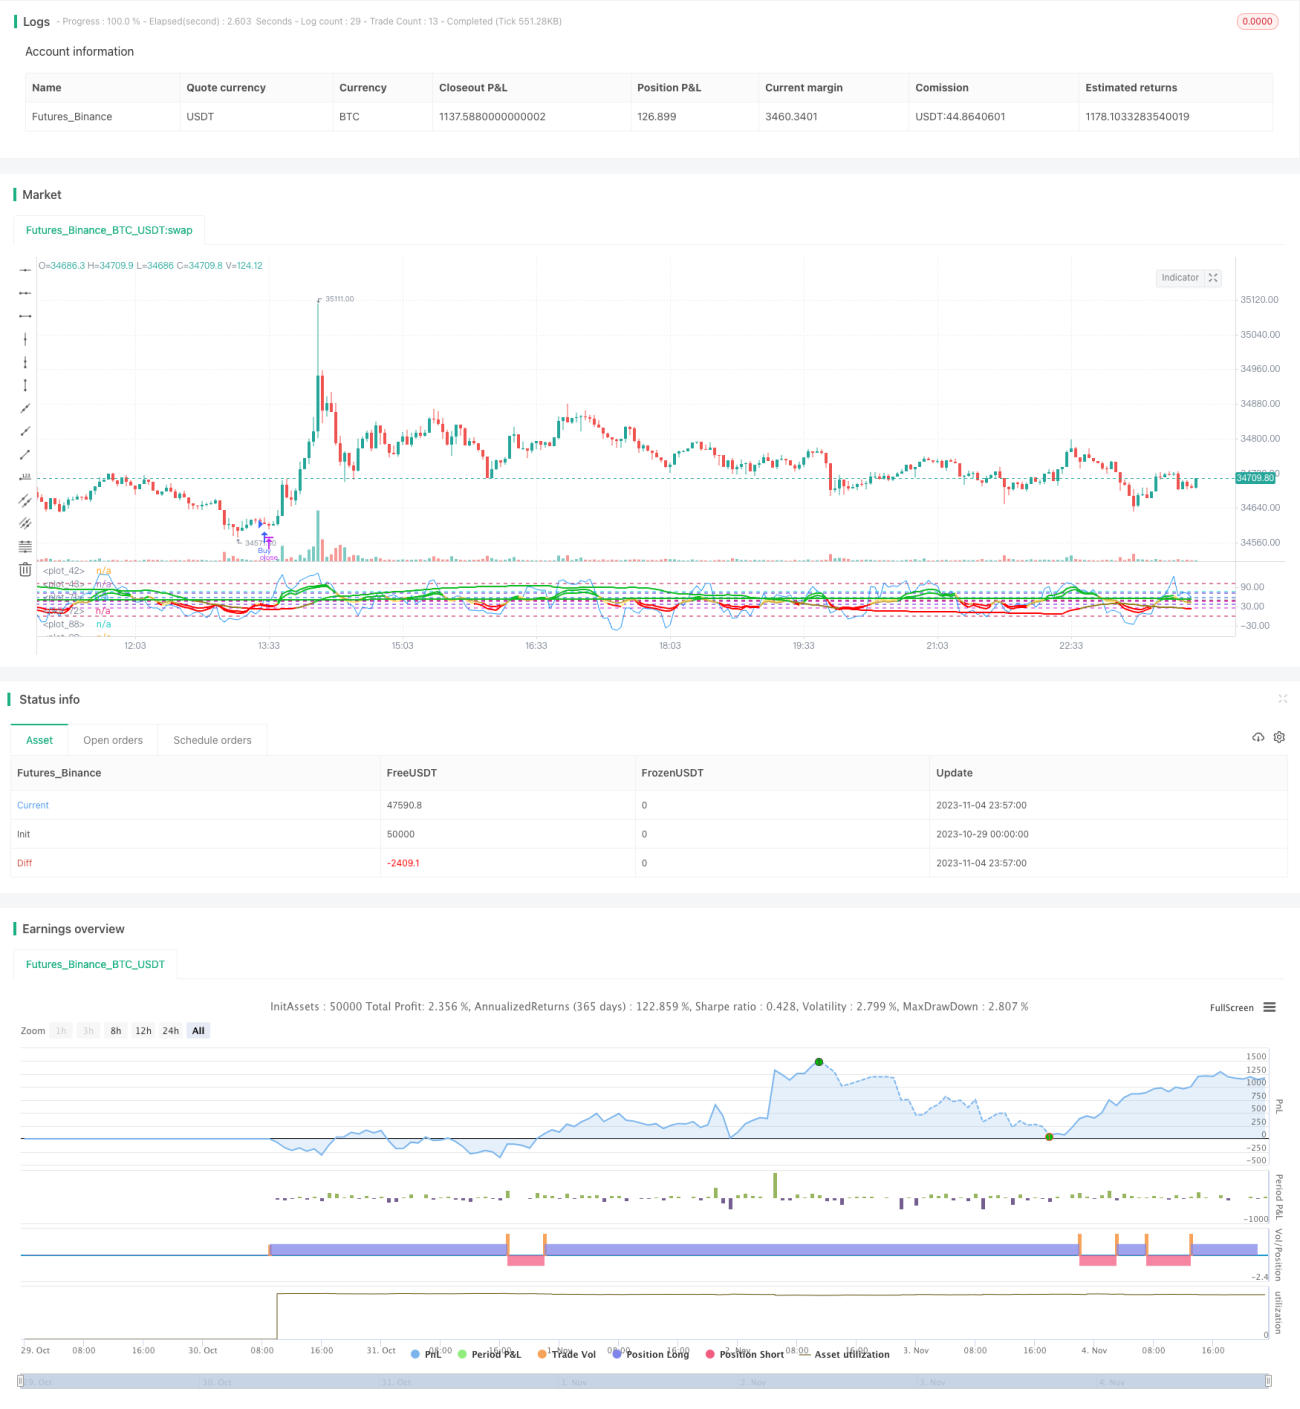
/*backtest
start: 2023-10-29 00:00:00
end: 2023-11-05 00:00:00
period: 3m
basePeriod: 1m
exchanges: [{"eid":"Futures_Binance","currency":"BTC_USDT"}]
*/

//@version=4
strategy(title="Super Momentum Strat", shorttitle="SMS", format=format.price, precision=2)

//* Backtesting Period Selector | Component *//- 1