
Cette stratégie utilise un ensemble d’indicateurs techniques pour identifier la direction de la tendance, la suivre lorsque la tendance est dynamique et la rechercher pour obtenir des gains supplémentaires.
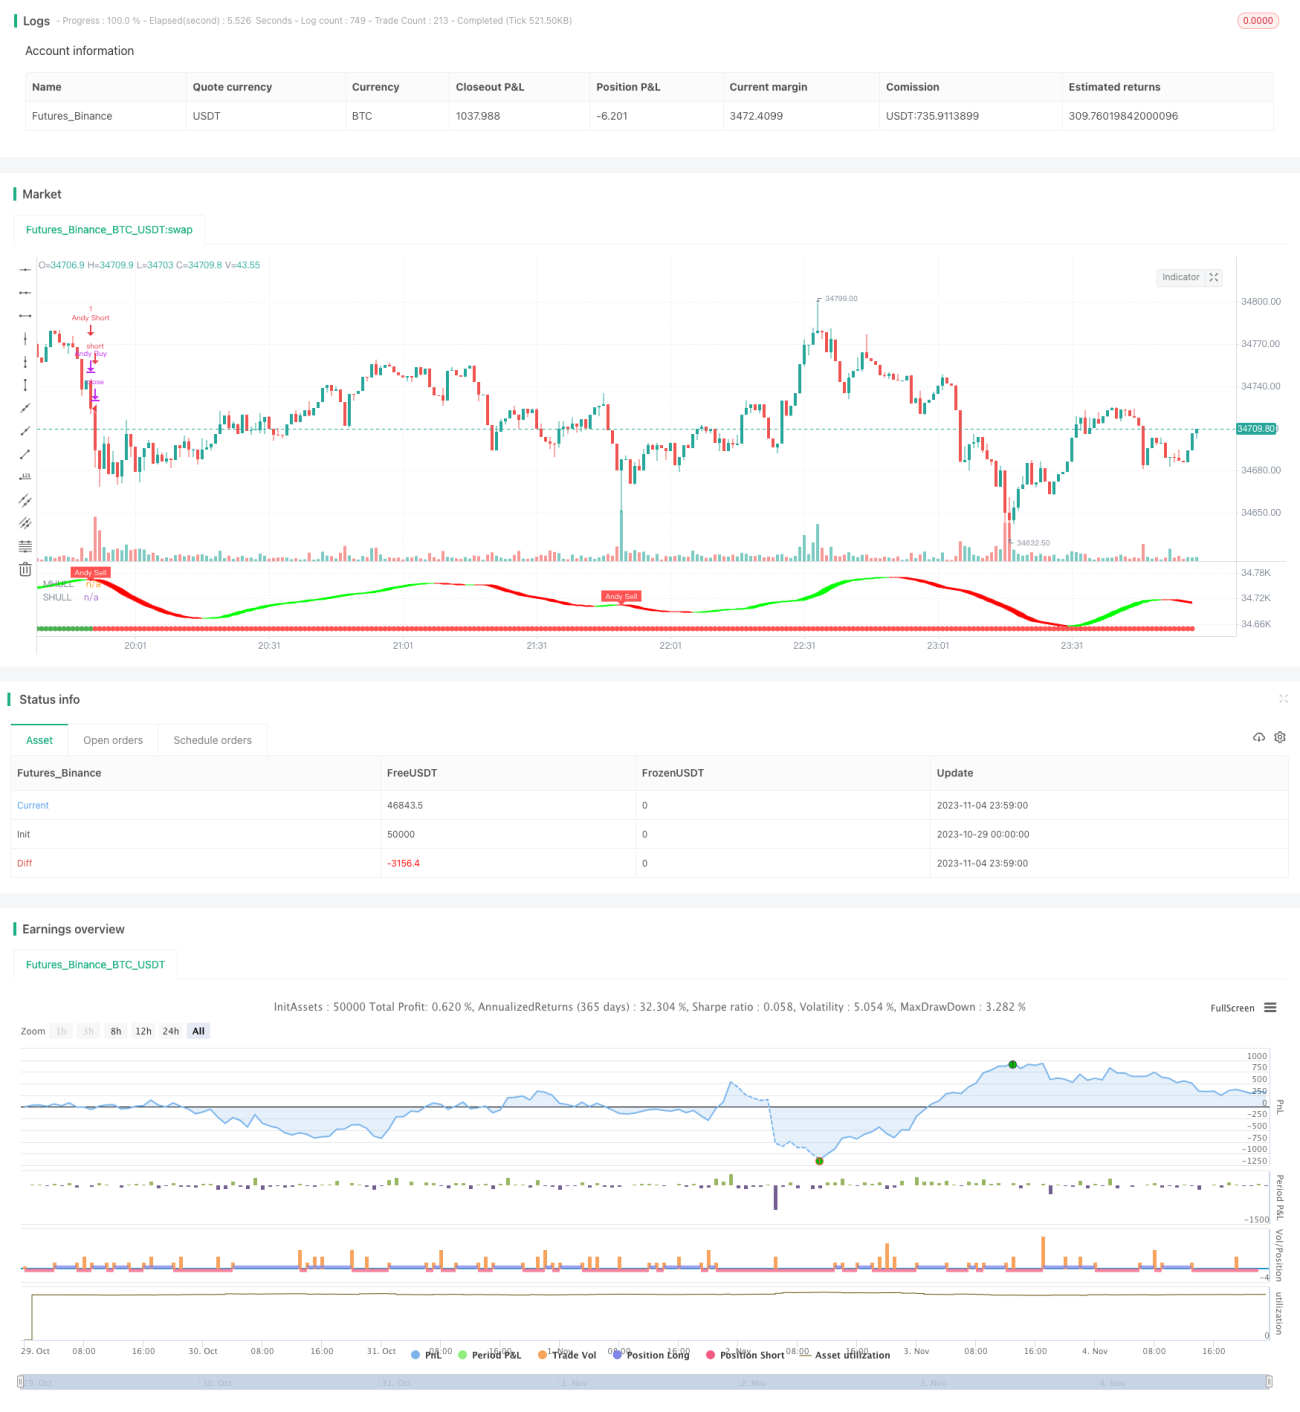
Utilisez le canal Donchian pour déterminer la direction de la tendance globale. Lorsque le prix franchit ce canal, confirmez que la tendance a changé.
Les moyennes mobiles de Hull aident à déterminer la direction de la tendance. L’indicateur est sensible aux changements de prix et permet de détecter les revirements de tendance à l’avance.
Le système semi-orbital émet des signaux d’achat et de vente. Le système est basé sur le canal de prix et la gamme de fluctuations réelles moyennes, ce qui permet d’éviter les fausses ruptures.
Lorsque le canal Donchian, l’indicateur Hull et le système semi-orbital émettent simultanément des signaux, il est jugé que la tendance a une rupture de dynamique puissante, qui entre alors dans le champ.
Condition de plage: lorsque les indicateurs ci-dessus émettent un signal de revers, déterminez le renversement de tendance et retirez-vous immédiatement.
Le Donchian détermine les fondamentaux, le Hull et la demi-orbite les détails, et les tendances sont précises.
La motivation est de participer à la rupture et de rechercher des gains supplémentaires. N’intervenez que lorsque la tendance est en forte rupture et évitez d’être coincé dans la secousse.
Il est nécessaire d’arrêter les pertes pour assurer la sécurité de l’argent.
La régulation des paramètres est flexible et s’adapte à tous les types de marchés. Les paramètres tels que la longueur des canaux et l’intervalle d’oscillation peuvent être ajustés et optimisés pour différents cycles.
La combinaison des indicateurs et des conditions est simple et facile à programmer.
La tendance est à la hausse, mais la tendance est à la baisse, et la tendance est à la hausse.
Les défaillances de percée peuvent entraîner des défaillances de percée et des retournements, entraînant des pertes.
L’indicateur émet un signal d’erreur. Le paramètre est mal réglé, ce qui peut entraîner une erreur de jugement.
Le nombre d’opérations est limité. L’entrée est possible uniquement si la tendance est clairement détectée et le nombre d’opérations annuelles est limité.
Optimiser les combinaisons de paramètres. Tester différents paramètres pour trouver la meilleure combinaison.
Augmenter les conditions de retrait linéaire de stop loss. Éviter de s’arrêter trop tôt et de rater des opportunités de tendance.
Ajout de filtres sur d’autres indicateurs, tels que le MACD, le KDJ et d’autres jugements auxiliaires, afin de réduire les signaux erronés.
Optimiser les périodes de transaction. Les paramètres peuvent être optimisés pour différentes périodes.
Accroître l’efficacité de l’utilisation des fonds.
Cette stratégie intègre plusieurs indicateurs pour déterminer le moment où la tendance se déclenche et atteint des gains supplémentaires en suivant la tendance qui s’est formée. Un mécanisme d’arrêt strict contrôle les risques et un ajustement flexible des paramètres pour s’adapter aux différents environnements du marché. Bien que la fréquence des transactions soit faible, chaque transaction cherche à obtenir un rendement élevé.
/*backtest
start: 2023-10-29 00:00:00
end: 2023-11-05 00:00:00
period: 1m
basePeriod: 1m
exchanges: [{"eid":"Futures_Binance","currency":"BTC_USDT"}]
*/
// This source code is subject to the terms of the Mozilla Public License 2.0 at https://mozilla.org/MPL/2.0/
// © kgynofomo
// @version=5
strategy(title="[Salavi] | Andy Super Pro Strategy",overlay = true)
//Doinchian Trend Ribbon
dlen = input.int(defval=30, minval=10)
dchannel(len) =>
float hh = ta.highest(len)
float ll = ta.lowest(len)
int trend = 0
trend := close > hh[1] ? 1 : close < ll[1] ? -1 : nz(trend[1])
trend
dchannelalt(len, maintrend) =>
float hh = ta.highest(len)
float ll = ta.lowest(len)
int trend = 0
trend := close > hh[1] ? 1 : close < ll[1] ? -1 : nz(trend[1])
maintrend == 1 ? trend == 1 ? #00FF00ff : #00FF009f : maintrend == -1 ? trend == -1 ? #FF0000ff : #FF00009f : na
maintrend = dchannel(dlen)
donchian_bull = maintrend==1
donchian_bear = maintrend==-1
//Hulls
src = input(hlc3, title='Source')
modeSwitch = input.string('Hma', title='Hull Variation', options=['Hma', 'Thma', 'Ehma'])
length = input(55, title='Length')
lengthMult = input(1.0, title='Length multiplier ')
useHtf = false
htf = '240'
switchColor = true
candleCol = false
visualSwitch = true
thicknesSwitch = 1
transpSwitch = 40
//FUNCTIONS
//HMA
HMA(_src, _length) =>
ta.wma(2 * ta.wma(_src, _length / 2) - ta.wma(_src, _length), math.round(math.sqrt(_length)))
//EHMA
EHMA(_src, _length) =>
ta.ema(2 * ta.ema(_src, _length / 2) - ta.ema(_src, _length), math.round(math.sqrt(_length)))
//THMA
THMA(_src, _length) =>
ta.wma(ta.wma(_src, _length / 3) * 3 - ta.wma(_src, _length / 2) - ta.wma(_src, _length), _length)
//SWITCH
Mode(modeSwitch, src, len) =>
modeSwitch == 'Hma' ? HMA(src, len) : modeSwitch == 'Ehma' ? EHMA(src, len) : modeSwitch == 'Thma' ? THMA(src, len / 2) : na
//OUT
_hull = Mode(modeSwitch, src, int(length * lengthMult))
HULL = useHtf ? request.security(syminfo.ticker, htf, _hull) : _hull
MHULL = HULL[0]
SHULL = HULL[2]
//COLOR
hullColor = switchColor ? HULL > HULL[2] ? #00ff00 : #ff0000 : #ff9800
hull_bull = HULL > HULL[2]
bull_start = hull_bull and hull_bull[1]==false
hull_bear = HULL < HULL[2]
bear_start = hull_bear and hull_bear[1]==false
barcolor(color=candleCol ? switchColor ? hullColor : na : na)
//halftrend
amplitude = input(title='Amplitude', defval=2)
channelDeviation = input(title='Channel Deviation', defval=2)
// showArrows = input(title='Show Arrows', defval=true)
// showChannels = input(title='Show Channels', defval=true)
var int trend = 0
var int nextTrend = 0
var float maxLowPrice = nz(low[1], low)
var float minHighPrice = nz(high[1], high)
var float up = 0.0
var float down = 0.0
float atrHigh = 0.0
float atrLow = 0.0
float arrowUp = na
float arrowDown = na
atr2 = ta.atr(100) / 2
dev = channelDeviation * atr2
highPrice = high[math.abs(ta.highestbars(amplitude))]
lowPrice = low[math.abs(ta.lowestbars(amplitude))]
highma = ta.sma(high, amplitude)
lowma = ta.sma(low, amplitude)
if nextTrend == 1
maxLowPrice := math.max(lowPrice, maxLowPrice)
if highma < maxLowPrice and close < nz(low[1], low)
trend := 1
nextTrend := 0
minHighPrice := highPrice
minHighPrice
else
minHighPrice := math.min(highPrice, minHighPrice)
if lowma > minHighPrice and close > nz(high[1], high)
trend := 0
nextTrend := 1
maxLowPrice := lowPrice
maxLowPrice
if trend == 0
if not na(trend[1]) and trend[1] != 0
up := na(down[1]) ? down : down[1]
arrowUp := up - atr2
arrowUp
else
up := na(up[1]) ? maxLowPrice : math.max(maxLowPrice, up[1])
up
atrHigh := up + dev
atrLow := up - dev
atrLow
else
if not na(trend[1]) and trend[1] != 1
down := na(up[1]) ? up : up[1]
arrowDown := down + atr2
arrowDown
else
down := na(down[1]) ? minHighPrice : math.min(minHighPrice, down[1])
down
atrHigh := down + dev
atrLow := down - dev
atrLow
ht = trend == 0 ? up : down
var color buyColor = color.blue
var color sellColor = color.red
htColor = trend == 0 ? buyColor : sellColor
// htPlot = plot(ht, title='HalfTrend', linewidth=2, color=htColor)
// atrHighPlot = plot(showChannels ? atrHigh : na, title='ATR High', style=plot.style_circles, color=color.new(sellColor, 0))
// atrLowPlot = plot(showChannels ? atrLow : na, title='ATR Low', style=plot.style_circles, color=color.new(buyColor, 0))
// fill(htPlot, atrHighPlot, title='ATR High Ribbon', color=color.new(sellColor, 90))
// fill(htPlot, atrLowPlot, title='ATR Low Ribbon', color=color.new(buyColor, 90))
HalfTrend_buySignal = not na(arrowUp) and trend == 0 and trend[1] == 1
HalfTrend_sellSignal = not na(arrowDown) and trend == 1 and trend[1] == 0
// plotshape(showArrows and buySignal ? atrLow : na, title='Arrow Up', style=shape.triangleup, location=location.absolute, size=size.tiny, color=color.new(buyColor, 0))
// plotshape(showArrows and sellSignal ? atrHigh : na, title='Arrow Down', style=shape.triangledown, location=location.absolute, size=size.tiny, color=color.new(sellColor, 0))
//ema
filter_ema = ta.ema(close,200)
ema_bull = close>filter_ema
ema_bear = close<filter_ema
atr_length = input.int(7)
atr = ta.atr(atr_length)
atr_rsi_length = input.int(50)
atr_rsi = ta.rsi(atr,atr_rsi_length)
atr_valid = atr_rsi>50
longCondition = bull_start and atr_valid
shortCondition = bear_start and atr_valid
Exit_long_condition = shortCondition
Exit_short_condition = longCondition
if longCondition
strategy.entry("Andy Buy",strategy.long, limit=close,comment="Andy Buy Here")
if Exit_long_condition
strategy.close("Andy Buy",comment="Andy Buy Out")
// strategy.entry("Andy fandan Short",strategy.short, limit=close,comment="Andy 翻單 short Here")
// strategy.close("Andy fandan Buy",comment="Andy short Out")
if shortCondition
strategy.entry("Andy Short",strategy.short, limit=close,comment="Andy short Here")
// strategy.exit("STR","Long",stop=longstoploss)
if Exit_short_condition
strategy.close("Andy Short",comment="Andy short Out")
// strategy.entry("Andy fandan Buy",strategy.long, limit=close,comment="Andy 翻單 Buy Here")
// strategy.close("Andy fandan Short",comment="Andy Buy Out")
inLongTrade = strategy.position_size > 0
inLongTradecolor = #58D68D
notInTrade = strategy.position_size == 0
inShortTrade = strategy.position_size < 0
// bgcolor(color = inLongTrade?color.rgb(76, 175, 79, 70):inShortTrade?color.rgb(255, 82, 82, 70):na)
plotshape(close!=0,location = location.bottom,color = inLongTrade?color.green:inShortTrade?color.red:na)
plotshape(longCondition, title='Buy', text='Andy Buy', style=shape.labelup, location=location.belowbar, color=color.new(color.green, 0), textcolor=color.new(color.white, 0), size=size.tiny)
plotshape(shortCondition, title='Sell', text='Andy Sell', style=shape.labeldown, location=location.abovebar, color=color.new(color.red, 0), textcolor=color.new(color.white, 0), size=size.tiny)
Fi1 = plot(MHULL, title='MHULL', color=hullColor, linewidth=thicknesSwitch, transp=50)
Fi2 = plot(SHULL, title='SHULL', color=hullColor, linewidth=thicknesSwitch, transp=50)
fill(Fi1, Fi2, title='Band Filler', color=hullColor, transp=transpSwitch)