Stratégie quantitative Dual CCI

Aperçu
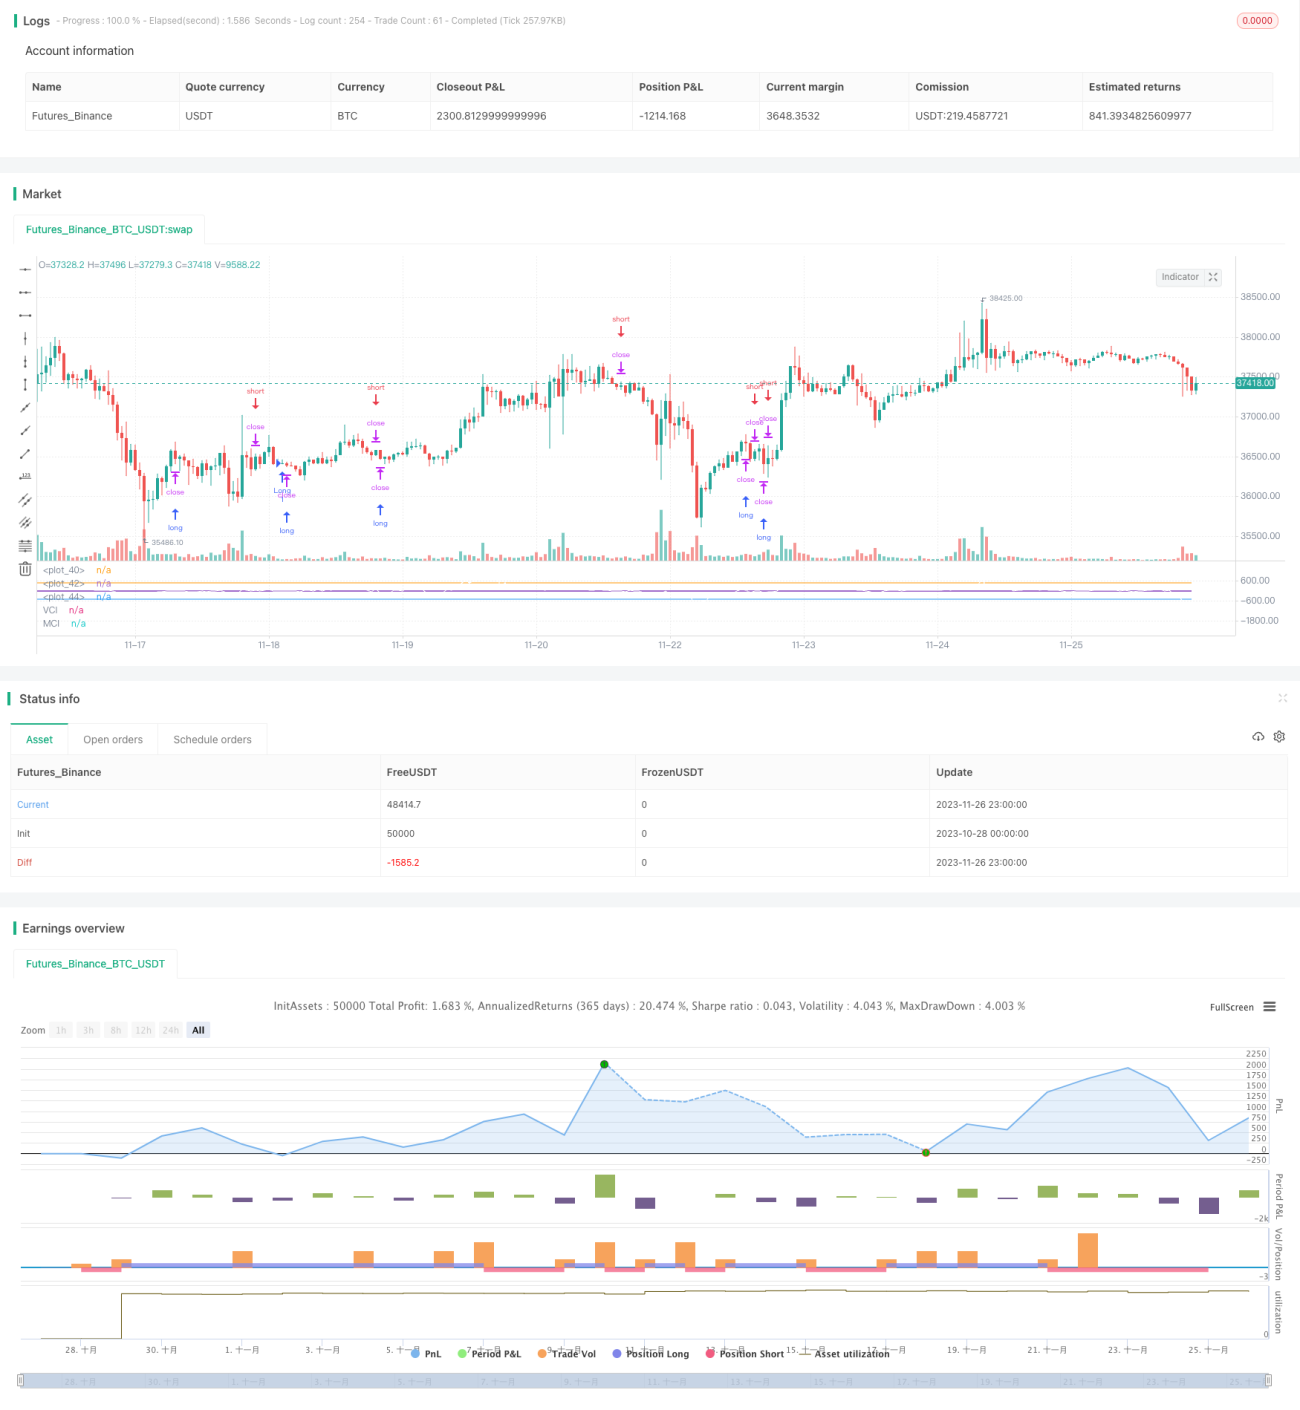
Cette stratégie est une stratégie de trading quantitative typique. Elle identifie les tendances des changements de volume et de prix, juge l'orientation et l'intensité des principales transactions sur le marché actuel et forme un signal de trading. Elle peut être largement utilisée dans les instruments financiers tels que les monnaies numériques, les devises et les actions.
Principe de stratégie
- Calculer la moyenne de l'ohlc4 et déterminer le prix en combinaison avec l'indicateur cici;
- Le calcul de l'indicateur OBV pour mesurer les flux de capitaux;
- Calculer l'indice VCI, qui mesure la distribution des flux de fonds par rapport à l'indice OBV;
- Calculer l'indice MCI, qui mesure la distribution des prix par la différence de prix;
- Le VCI est comparé à l'indice MCI pour évaluer les tendances de l'offre et de la demande;
- VCI > MCI, les acheteurs sont prêts;
- VCI < MCI, le vendeur est disposé;
- Les signaux de plus-que-moins sont formés sur la base d'une comparaison entre le VCI et le MCI;
Analyse des avantages
- La stratégie prend en compte les prix, le volume des transactions et les flux de fonds sur plusieurs dimensions, et les signaux sont plus précis pour juger de l'état des marchés.
- Les VCI et les MCI sont capables de s'adapter aux changements du marché en temps réel grâce à des calculs dynamiques de standardisation;
- Les paramètres de la stratégie ont été optimisés par un grand nombre de retours d'expérience et présentent une forte stabilité;
Analyse des risques
- Les indicateurs de prix et de volume de transactions sont calculés en retard et ne permettent pas de saisir les événements imprévus à l'avance;
- Une stratégie unique ne peut pas couvrir complètement une situation de marché complexe et changeante.
- Le marché ne peut être jugé seul, il doit être utilisé en combinaison avec d'autres indicateurs auxiliaires.
Direction d'optimisation
- Les modèles de prévision, combinés à l'apprentissage en profondeur, améliorent l'exactitude des signaux de jugement.
- L'augmentation des modules de contrôle des risques tels que le stop-loss et la stabilité de la stratégie;
- La possibilité d'essayer différentes combinaisons de paramètres pour tester leur applicabilité dans un marché donné;
Résumer
Cette stratégie consiste à comparer les indices CCI pour former un signal de transaction, en tenant compte de plusieurs facteurs tels que le prix et le volume des transactions, et en évaluant la force d'achat et de vente du marché. C'est une stratégie de trading quantifiée typique et pratique. Cependant, il est toujours nécessaire de l'utiliser avec d'autres outils auxiliaires pour tirer le meilleur parti de la stratégie.
- 1