Stratégie de trading hybride de tortues de rupture de moyenne mobile

Aperçu
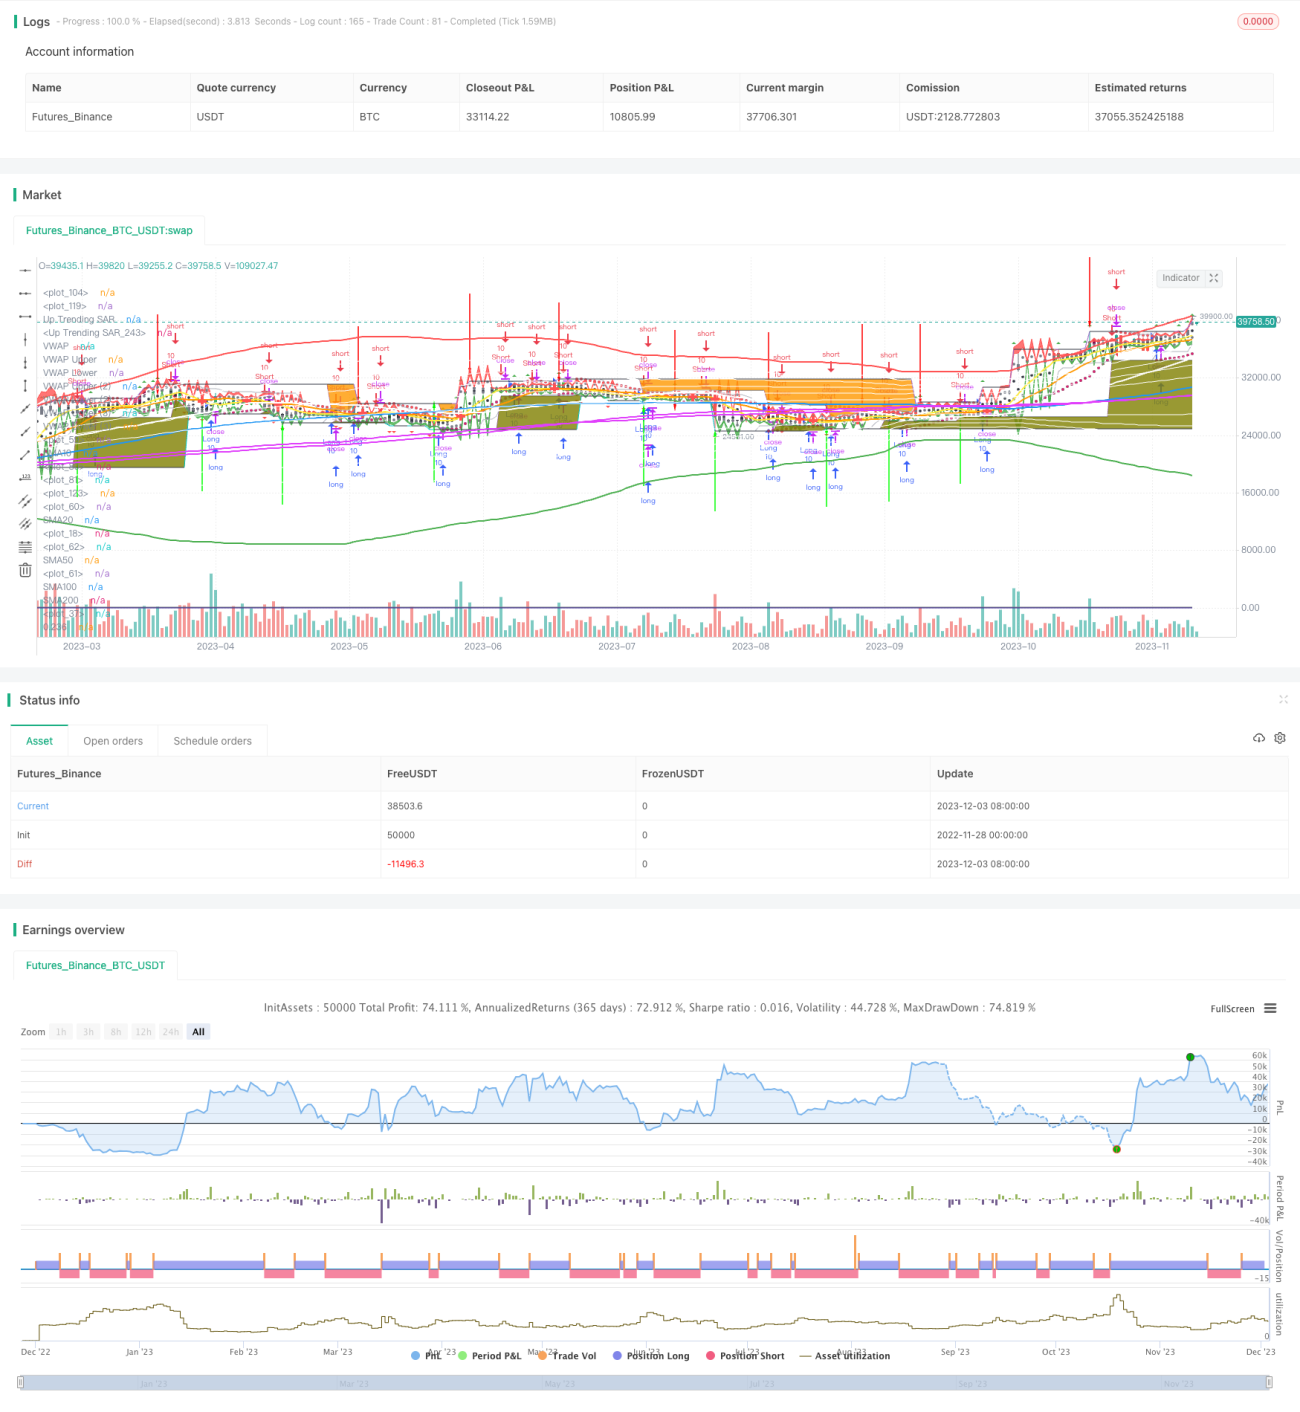
Cette stratégie utilise une combinaison d'outils d'analyse technique tels que les moyennes mobiles, les indicateurs de volatilité, les prix moyens pondérés en volume de transaction (VWAP) et les indicateurs de stop-loss parallèles pour réaliser une stratégie de trading Turtle hybride dotée d'une forte capacité de détection de rupture et de protection contre les pertes.
Principe de stratégie
- Utilisez une combinaison de SMA de différentes périodes pour déterminer la direction de la tendance et les points de rupture possibles
- Utilisation de l'indicateur de volatilité Brin pour juger de la survente à court terme
- Zone de prix équilibré de la ligne moyenne longue utilisant l'indicateur VWAP
- La SAR parabolique comme indicateur de stop loss et de réduction des pertes
- La loi de Turtle génère des signaux d'achat et de vente
Analyse des avantages
- Plus d'indicateurs, plus de jugement et plus de précision
- L'indicateur VWAP aide à déterminer la fourchette de prix raisonnable et à éviter la poursuite aveugle de prix plus élevés
- L'indicateur de stop-loss SAR contrôle efficacement la perte de chaque position
- La règle de Turtle assure le bon moment pour entrer en position
Analyse des risques
- Une mauvaise configuration des paramètres peut entraîner une fréquence de transaction trop élevée ou une erreur de signal
- La seule méthode de stop-loss limite l'espace de profit
- Les signaux de Turtle doivent être filtrés pour éviter les conflits
Direction d'optimisation
- Ajustez les paramètres de la période moyenne SMA pour optimiser la reconnaissance des ruptures
- Ajustement des paramètres de volatilité pour rapprocher la zone de Brin du prix
- Optimisation des paramètres de la parabole pour un arrêt plus précis
- Filtrage des signaux Turtle en combinaison avec d'autres indicateurs
Résumer
Cette stratégie est une combinaison organique de plusieurs indicateurs, formant un signal de négociation plus précis, une capacité d'arrêt plus forte et un espace d'ajustement des paramètres plus grand. La stratégie de type Turtle, une stratégie de rupture mixte. Une fois que les paramètres ont été correctement ajustés, sa capacité à identifier la rupture et à protéger la rupture sera améliorée.
/*backtest
start: 2022-11-28 00:00:00
end: 2023-12-04 00:00:00
period: 1d
basePeriod: 1h
exchanges: [{"eid":"Futures_Binance","currency":"BTC_USDT"}]
*/

//@version=4
strategy("Gui's Turtle", shorttitle = "Guis Turtles", overlay=true, pyramiding=0, default_qty_value = 10)

//This script has to be used with Heikin Ashi Caddles for the strategy to work well- 1