Stratégie de suivi de super tendance avec stop loss

Aperçu
La stratégie est basée sur les indicateurs de surtrend et le suivi des arrêts pour ouvrir des positions de paix. Elle utilise 4 alarmes pour ouvrir des positions de paix et utilise la stratégie de surtrend. La stratégie est spécialement conçue pour les robots et a la fonction de suivi des arrêts.
Principe de stratégie
La stratégie utilise l'indicateur ATR pour calculer les hauts et les bas. Lorsque le prix de clôture dépasse le haut, un signal d'achat est généré, et lorsqu'il dépasse le bas, un signal de vente est généré. La stratégie utilise également une ligne de tendance supérieure pour déterminer la direction de la tendance.
Analyse des avantages
Cette stratégie combine les avantages de l'indicateur hypertrend pour déterminer la direction de la tendance et de l'indicateur ATR pour définir le stop loss, ce qui permet de filtrer efficacement les faux-breaks. Le suivi du stop loss peut très bien bloquer les bénéfices et réduire les retraits.
Analyse des risques
L'indicateur de tendance supérieure est plus susceptible de générer de faux signaux. Une correction plus importante du prix d'arrêt augmente la probabilité que le blocage soit franchi. De plus, les robots de trading sont également exposés à des risques techniques tels que des pannes de serveur et des pannes de réseau.
Pour réduire la probabilité d'erreurs, il est possible d'ajuster les paramètres ATR ou d'ajouter d'autres indicateurs pour filtrer. L'ajustement de l'amplitude de suivi des pertes d'arrêt nécessite un équilibre entre le profit et le risque.
Direction d'optimisation
Cette stratégie peut être optimisée dans les domaines suivants:
-
Ajouter des indicateurs ou des conditions pour filtrer les signaux entrants et éviter les faux signaux. Par exemple, ajouter un indicateur MACD.
-
Il est possible de tester différentes combinaisons de paramètres ATR pour trouver le paramètre optimal.
-
L'optimisation de la traçabilité de stop loss permet de trouver le point d'équilibre optimal.
-
Il est possible d'ajouter plus de prix de stop-loss pour réaliser un stop-loss par lots.
-
L'architecture de double serveur de secours peut être mise en place, permettant une commutation rapide en cas de panne du serveur principal.
Résumer
Cette stratégie intègre les avantages de l'indicateur de surtrend et du suivi des arrêts de perte, permettant d'automatiser l'ouverture et la fermeture des positions. Les améliorations combinées à l'optimisation des directions dans le réel peuvent être une stratégie de trading quantitative très pratique.
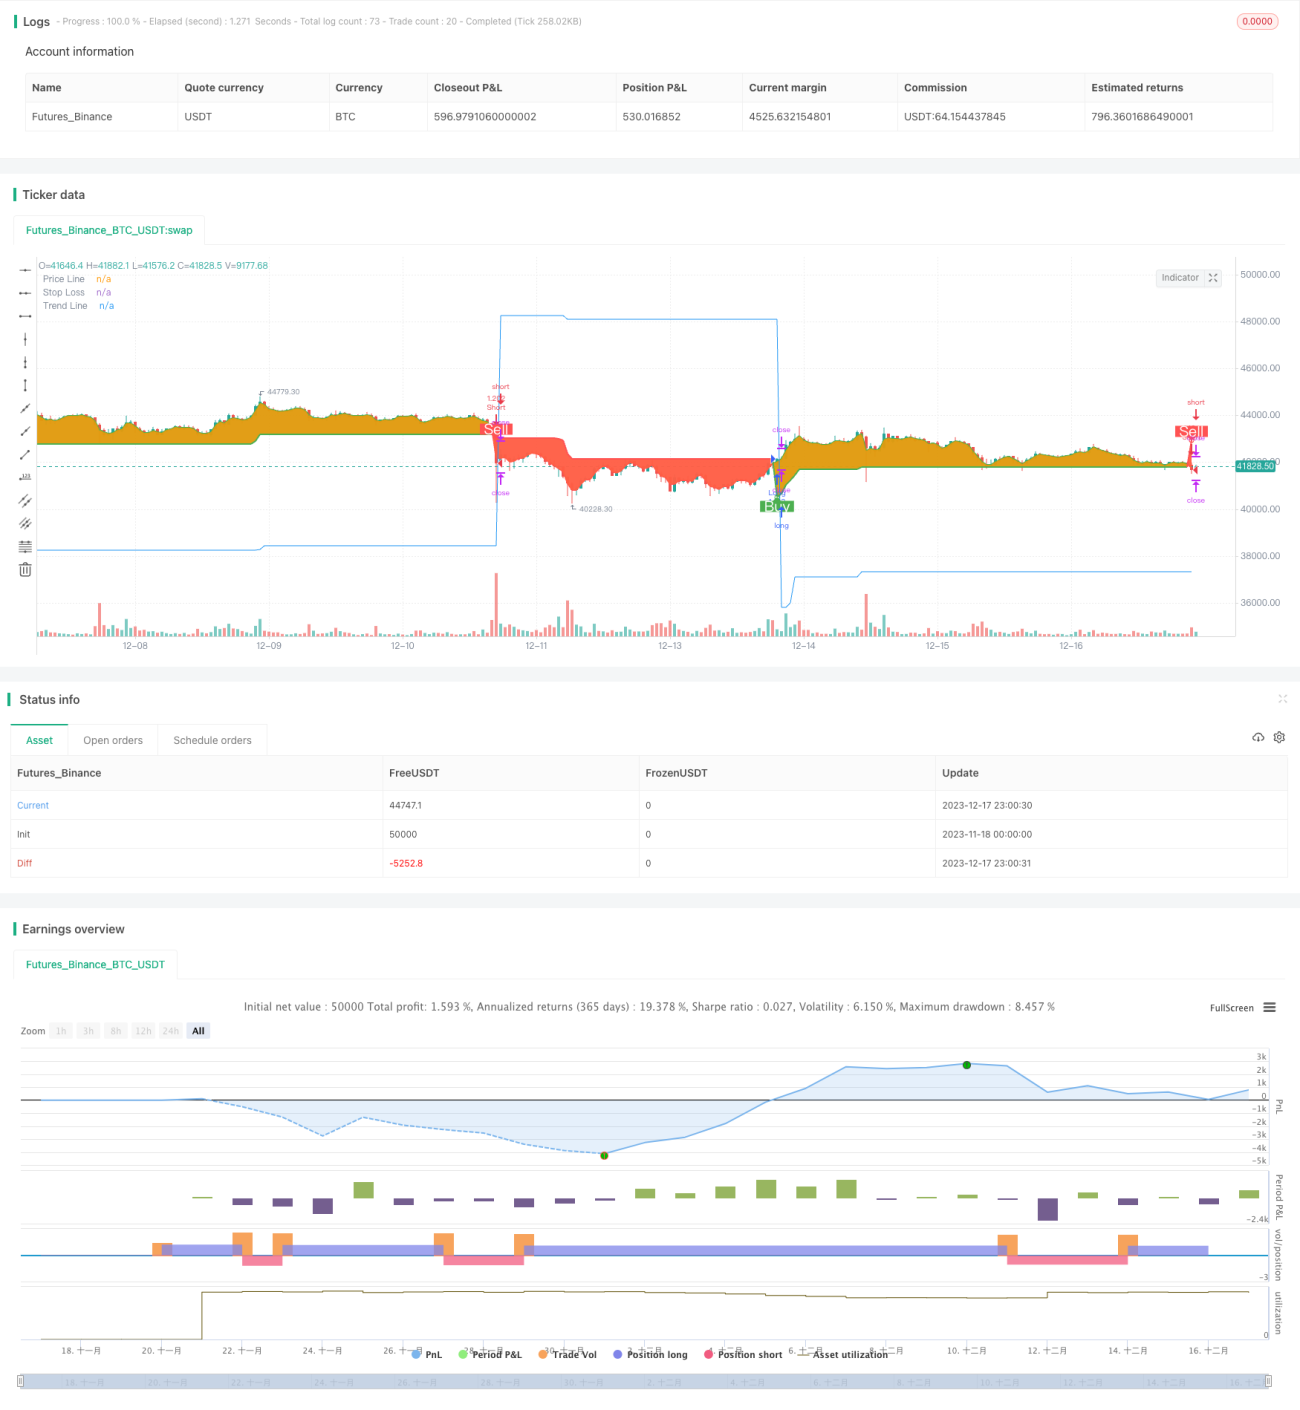
/*backtest
start: 2023-11-18 00:00:00
end: 2023-12-18 00:00:00
period: 1h
basePeriod: 15m
exchanges: [{"eid":"Futures_Binance","currency":"BTC_USDT"}]
*/

// This source code is subject to the terms of the Mozilla Public License 2.0 at https://mozilla.org/MPL/2.0/
// © arminomid1375
//@version=5
strategy('Mizar_BOT_super trend', overlay=true, default_qty_value=100, currency=currency.USD, default_qty_type=strategy.percent_of_equity, initial_capital=100, max_bars_back=4000)- 1