Stratégie d'achat haut et de vente bas basée sur la ligne pivot de la section dorée
Aperçu
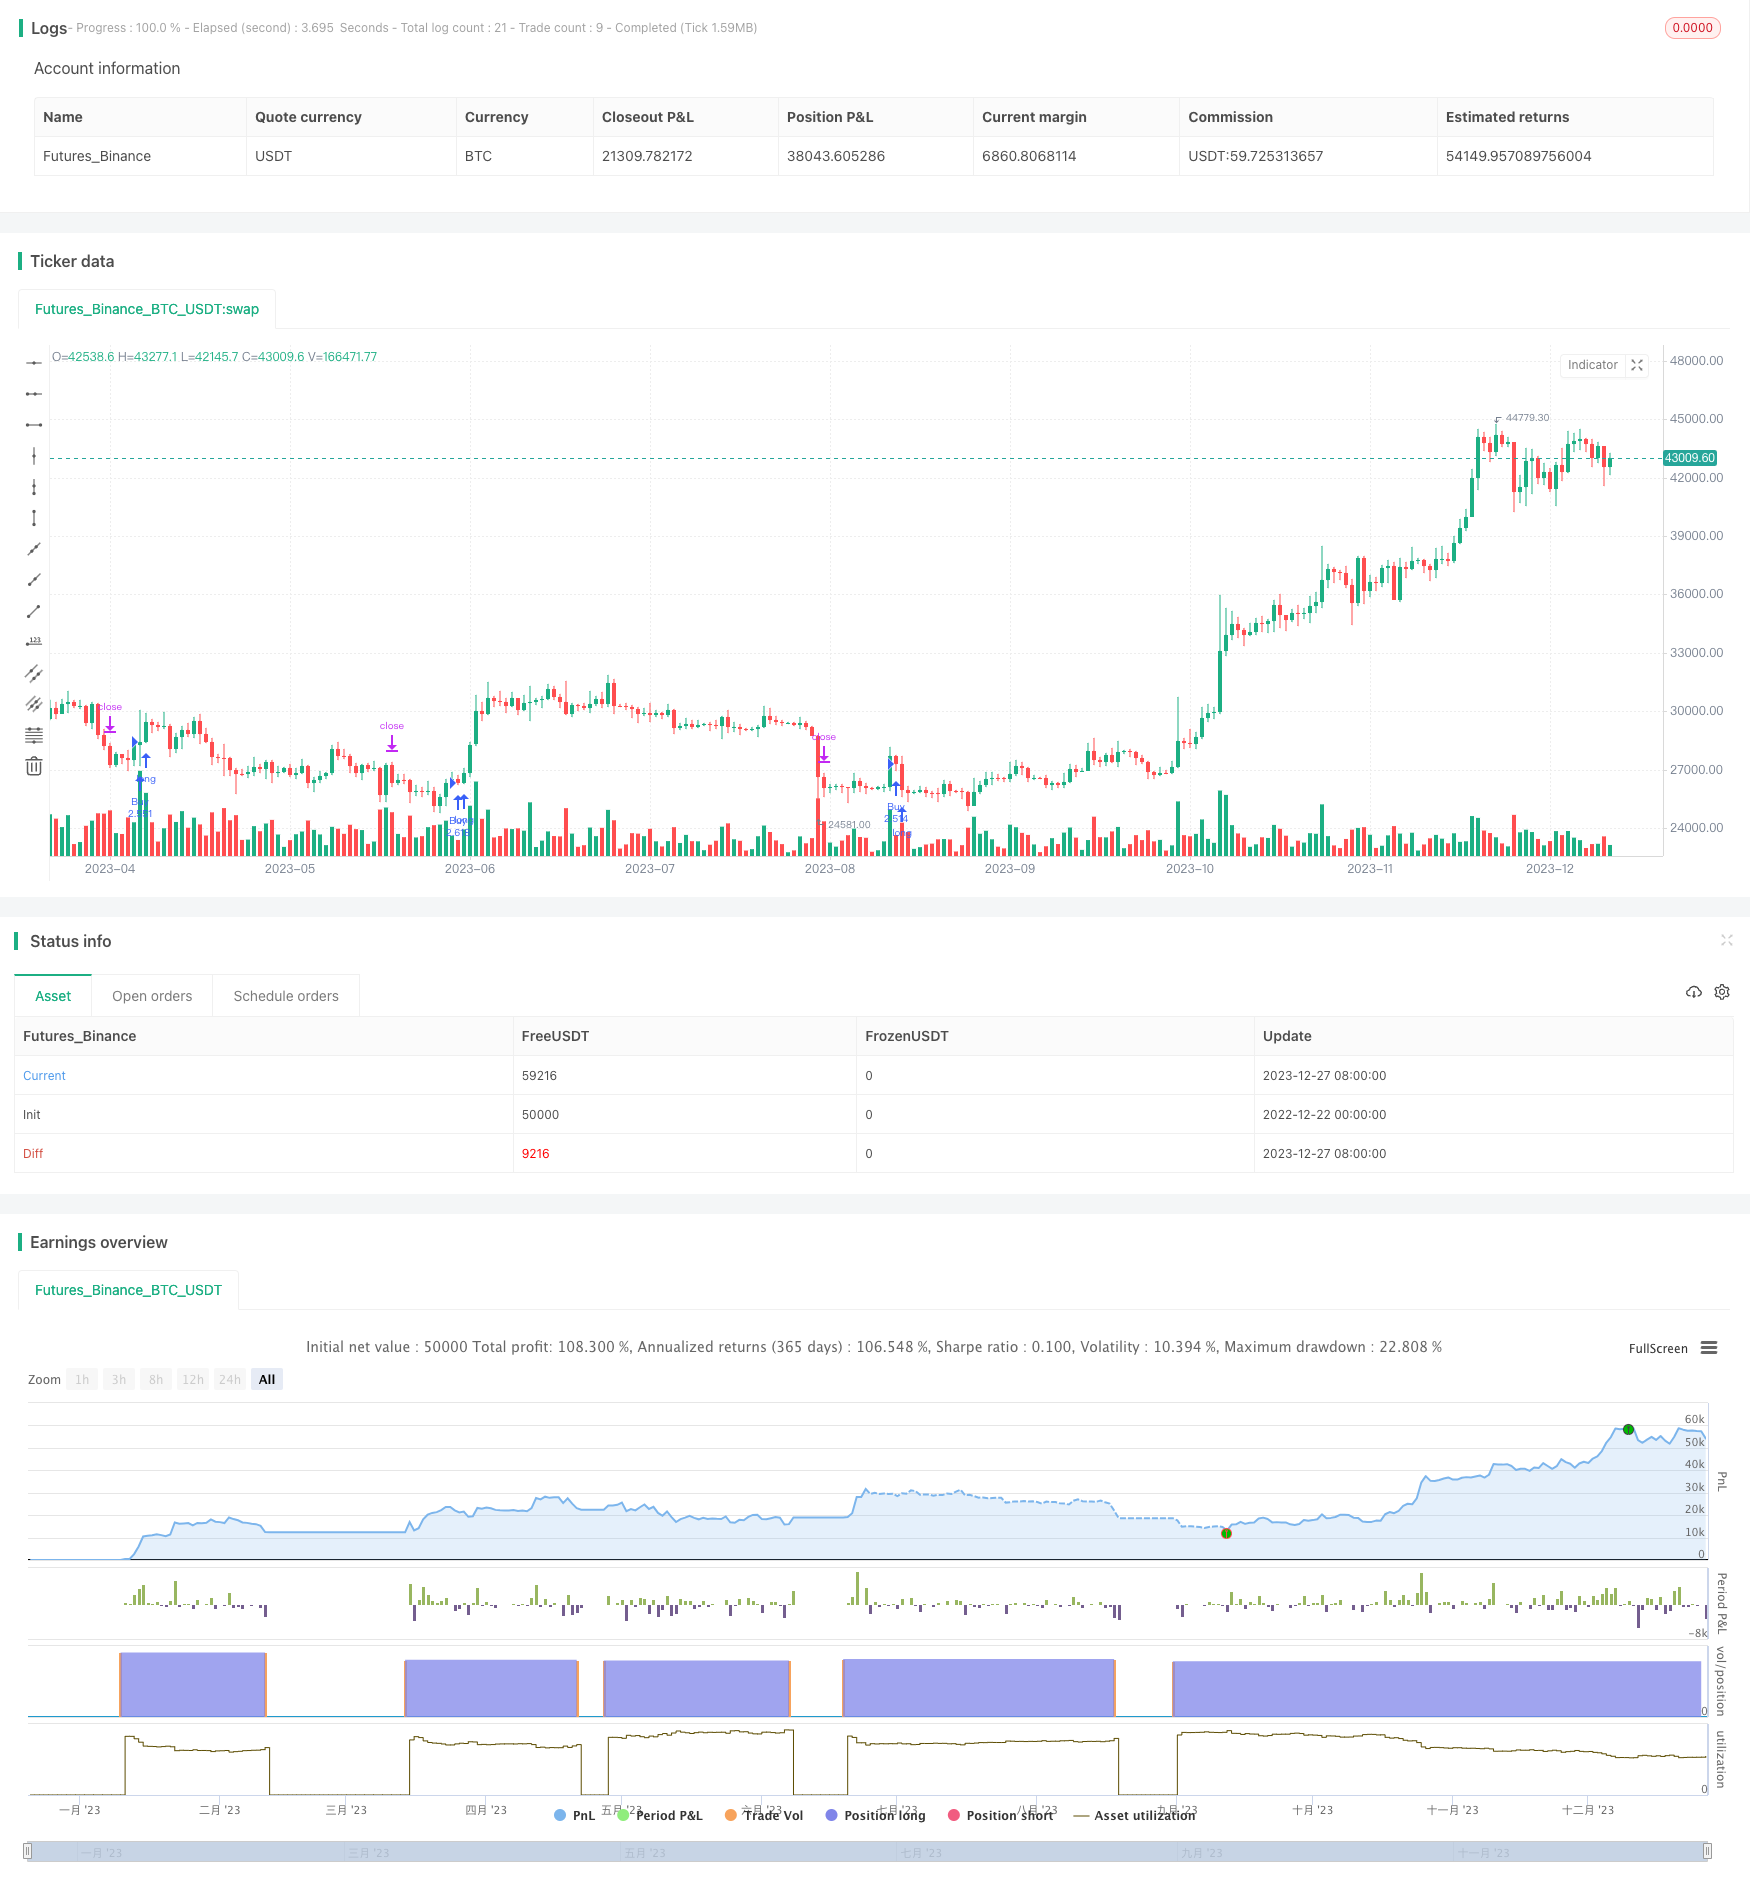
Cette stratégie utilise les points de référence de différentes périodes de temps comme zones de prix clés pour déterminer la direction de la tendance, combinée au principe de la ligne de séparation de l’or, et permet une stratégie de négociation à bas prix.
Principe de stratégie
Calculer les points d’appui des prix de clôture, des prix les plus élevés et des prix les plus bas de différentes périodes de temps.
En fonction de la hausse ou de la baisse des prix, déterminez la zone de prix dans laquelle vous vous trouvez actuellement. Elle est divisée en 5 zones d’achat et 5 zones de vente.
Envoyez un signal d’achat dans la zone d’achat et un signal de vente dans la zone de vente, et utilisez une stratégie d’achat et de vente bas.
Analyse des avantages
Il est important de ne pas se laisser induire en erreur par le bruit du marché en utilisant plusieurs périodes pour juger des tendances.
La combinaison de l’axe classique et de l’axe de division en or améliore la fiabilité de l’axe.
Il est important de déterminer le moment de la mise sur le marché en fonction de la zone de prix, afin d’éviter au maximum le risque de pertes.
Utilisez des stratégies d’achat et de vente à la hausse, en respectant les règles de la tendance et en évitant le contrecoup.
Analyse des risques
Les points d’appui risquent de ne pas fonctionner, il faut faire attention à la rupture des points d’appui.
Il est nécessaire d’éviter que le suivi des pertes ne soit défavorable et ne aggrave les pertes.
Les frais de transaction peuvent aussi avoir une incidence sur les bénéfices finaux.
Direction d’optimisation
Il est possible de tester différents paramètres, tels que les paramètres de périodes de temps, les paramètres de direction des transactions, etc., afin d’optimiser la stratégie.
Il peut être combiné avec d’autres indicateurs pour identifier les tendances et éviter les faux rebondissements.
Des mécanismes de stop-loss peuvent être ajoutés pour contrôler les pertes individuelles.
Résumer
Cette stratégie intègre les méthodes classiques d’analyse technique et les stratégies de trading de tendance, utilise les zones de support pour déterminer le moment d’entrée sur le marché, et adopte le principe de l’achat et de la vente à bas prix, ce qui permet de contrôler efficacement les risques de négociation et mérite d’être vérifié et optimisé sur le terrain.
/*backtest
start: 2022-12-22 00:00:00
end: 2023-12-28 00:00:00
period: 1d
basePeriod: 1h
exchanges: [{"eid":"Futures_Binance","currency":"BTC_USDT"}]
*/

// This source code is subject to the terms of the Mozilla Public License 2.0 at https://mozilla.org/MPL/2.0/
// © HeWhoMustNotBeNamed

//@version=4
strategy("BuyHighSellLow - Pivot points", overlay=true, initial_capital = 100000, default_qty_type = strategy.percent_of_equity, default_qty_value = 100, commission_type = strategy.commission.percent, pyramiding = 1, commission_value = 0.01, calc_on_order_fills = true)
Source = input(close)
resolution = input("4D", type=input.resolution)
HTFMultiplier = input(4, title="Higher Timeframe multiplier (Used when resolution is set to Same as Symbol)", minval=2, step=1)
//ppType = input(title="Pivot points type", defval="classic", options=["classic", "fib"])
ppType = "fib"
tradeDirection = input(title="Trade Direction", defval=strategy.direction.long, options=[strategy.direction.all, strategy.direction.long, strategy.direction.short])
backtestBars = input(title="Backtest from ", defval=10, minval=1, maxval=30)
backtestFrom = input(title="Timeframe", defval="years", options=["days", "months", "years"])
hideBands = input(true)
f_multiple_resolution(HTFMultiplier) =>
    target_Res_In_Min = timeframe.multiplier * HTFMultiplier * (
      timeframe.isseconds   ? 1. / 60. :
      timeframe.isminutes   ? 1. :
      timeframe.isdaily     ? 1440. :
      timeframe.isweekly    ? 7. * 24. * 60. :
      timeframe.ismonthly   ? 30.417 * 24. * 60. : na)

    target_Res_In_Min     <= 0.0417       ? "1S"  :
      target_Res_In_Min   <= 0.167        ? "5S"  :
      target_Res_In_Min   <= 0.376        ? "15S" :
      target_Res_In_Min   <= 0.751        ? "30S" :
      target_Res_In_Min   <= 1440         ? tostring(round(target_Res_In_Min)) :
      tostring(round(min(target_Res_In_Min / 1440, 365))) + "D"

f_getBackTestTimeFrom(backtestFrom, backtestBars)=>
    byDate = backtestFrom == "days"
    byMonth = backtestFrom == "months"
    byYear = backtestFrom == "years"

    date = dayofmonth(timenow)
    mth = month(timenow)
    yr = year(timenow)

    leapYearDaysInMonth = array.new_int(12,0)
    array.set(leapYearDaysInMonth,0,31)
    array.set(leapYearDaysInMonth,1,29)
    nonleapYearDaysInMonth = array.new_int(12,0)
    array.set(leapYearDaysInMonth,0,31)
    array.set(leapYearDaysInMonth,1,28)

    restMonths = array.new_int(10,0)
    array.set(leapYearDaysInMonth,0,31)
    array.set(leapYearDaysInMonth,1,30)
    array.set(leapYearDaysInMonth,2,31)
    array.set(leapYearDaysInMonth,3,30)
    array.set(leapYearDaysInMonth,4,31)
    array.set(leapYearDaysInMonth,5,31)
    array.set(leapYearDaysInMonth,6,30)
    array.set(leapYearDaysInMonth,7,31)
    array.set(leapYearDaysInMonth,8,30)
    array.set(leapYearDaysInMonth,9,31)

    array.concat(leapYearDaysInMonth,restMonths)
    array.concat(nonleapYearDaysInMonth,restMonths)
    isLeapYear = yr % 4 == 0 and (year%100 != 0 or year%400 == 0)
    numberOfDaysInCurrentMonth = isLeapYear ? array.get(leapYearDaysInMonth, mth-2) : array.get(nonleapYearDaysInMonth, mth-2)
    if(byDate)
        mth := (date - backtestBars) < 0 ? mth - 1 : mth
        yr := mth < 1 ? yr - 1 : yr
        mth := mth < 1 ? 1 : mth
        date := (date - backtestBars) < 0 ? numberOfDaysInCurrentMonth - backtestBars + date + 1 : date - backtestBars + 1
    if(byMonth)
        date := 1
        yr := (mth - (backtestBars%12)) < 0 ? yr - int(backtestBars/12) - 1 : yr - int(backtestBars/12)
        mth := mth - (backtestBars%12) + 1
    if(byYear)
        date := 1
        mth := 1
        yr := yr - backtestBars
    [date, mth, yr]

f_secureSecurity(_symbol, _res, _src) => security(_symbol, _res, _src[1], lookahead = barmerge.lookahead_on)

f_getClassicPivots(HIGHprev, LOWprev, CLOSEprev)=>
    PP = (HIGHprev + LOWprev + CLOSEprev) / 3
    R1 = PP * 2 - LOWprev
    S1 = PP * 2 - HIGHprev
    R2 = PP + (HIGHprev - LOWprev)
    S2 = PP - (HIGHprev - LOWprev)
    R3 = PP * 2 + (HIGHprev - 2 * LOWprev)
    S3 = PP * 2 - (2 * HIGHprev - LOWprev)
    R4 = PP * 3 + (HIGHprev - 3 * LOWprev)
    S4 = PP * 3 - (3 * HIGHprev - LOWprev)
    R5 = PP * 4 + (HIGHprev - 4 * LOWprev)
    S5 = PP * 4 - (4 * HIGHprev - LOWprev)
    [R5, R4, R3, R2, R1, PP, S1, S2, S3, S4, S5]

f_getFibPivots(HIGHprev, LOWprev, CLOSEprev)=>
    PP = (HIGHprev + LOWprev + CLOSEprev) / 3
    R1 = PP + 0.382 * (HIGHprev - LOWprev)
    S1 = PP - 0.382 * (HIGHprev - LOWprev)
    R2 = PP + 0.618 * (HIGHprev - LOWprev)
    S2 = PP - 0.618 * (HIGHprev - LOWprev)
    R3 = PP + (HIGHprev - LOWprev)
    S3 = PP - (HIGHprev - LOWprev)
    R4 = PP + 1.41 * (HIGHprev - LOWprev)
    S4 = PP - 1.41 * (HIGHprev - LOWprev)
    R5 = PP + 1.65 * (HIGHprev - LOWprev)
    S5 = PP - 1.65 * (HIGHprev - LOWprev)
    [R5, R4, R3, R2, R1, PP, S1, S2, S3, S4, S5]

f_getPivotPoints(HTFMultiplier, resolution, ppType)=>
    derivedResolution = resolution == ""? f_multiple_resolution(HTFMultiplier) : resolution
    HIGHprev = f_secureSecurity(syminfo.tickerid, derivedResolution, high)
    LOWprev = f_secureSecurity(syminfo.tickerid, derivedResolution, low)
    CLOSEprev = f_secureSecurity(syminfo.tickerid, derivedResolution, close)
    [R5, R4, R3, R2, R1, PP, S1, S2, S3, S4, S5] = f_getClassicPivots(HIGHprev, LOWprev, CLOSEprev)
    [Rf5, Rf4, Rf3, Rf2, Rf1, PPf, Sf1, Sf2, Sf3, Sf4, Sf5] = f_getFibPivots(HIGHprev, LOWprev, CLOSEprev)
    [R5, R4, R3, R2, R1, PP, S1, S2, S3, S4, S5]

f_getState(Source, R5, R4, R3, R2, R1, PP, S1, S2, S3, S4, S5)=>
    state =
     Source > R5 ? 5 :
     Source > R4 ? 4 :
     Source > R3 ? 3 :
     Source > R2 ? 2 :
     Source > R1 ? 1 :
     Source > PP ? 0 :
     Source > S1 ? -1 :
     Source > S2 ? -2 :
     Source > S3 ? -3 :
     Source > S4 ? -4 :
     Source > S5 ? -5 : -6
    state

[R5, R4, R3, R2, R1, PP, S1, S2, S3, S4, S5] = f_getPivotPoints(HTFMultiplier, resolution, ppType)

[date, mth, yr] = f_getBackTestTimeFrom(backtestFrom, backtestBars)
inDateRange = time >= timestamp(syminfo.timezone, yr, mth, date, 0, 0)

BBU5 = plot(not hideBands ? R5: na, title="R5", color=color.orange, linewidth=1, transp=50, style=plot.style_linebr)
BBU4 = plot(not hideBands ? R4: na, title="R4", color=color.yellow, linewidth=1, transp=50, style=plot.style_linebr)
BBU3 = plot(not hideBands ? R3: na, title="R3", color=color.navy, linewidth=1, transp=50, style=plot.style_linebr)
BBU2 = plot(not hideBands ? R2: na, title="R2", color=color.olive, linewidth=1, transp=50, style=plot.style_linebr)
BBU1 = plot(not hideBands ? R1: na, title="R1", color=color.lime, linewidth=1, transp=50, style=plot.style_linebr)
BBM4 = plot(not hideBands ? PP:na, title="PP", color=color.black, linewidth=2, style=plot.style_linebr)
BBL1 = plot(not hideBands ? S1: na, title="S1", color=color.lime, linewidth=1, transp=50, style=plot.style_linebr)
BBL2 = plot(not hideBands ? S2: na, title="S2", color=color.olive, linewidth=1, transp=50, style=plot.style_linebr)
BBL3 = plot(not hideBands ? S3: na, title="S3", color=color.navy, linewidth=1, transp=50, style=plot.style_linebr)
BBL4 = plot(not hideBands ? S4: na, title="S4", color=color.yellow, linewidth=1, transp=50, style=plot.style_linebr)
BBL5 = plot(not hideBands ? S5: na, title="S5", color=color.orange, linewidth=1, transp=50, style=plot.style_linebr)


fill(BBU5, BBU4, title="RZ5", color=color.green, transp=90)
fill(BBU4, BBU3, title="RZ4", color=color.lime, transp=90)
fill(BBU3, BBU2, title="RZ3", color=color.olive, transp=90)
fill(BBU2, BBU1, title="RZ2", color=color.navy, transp=90)
fill(BBU1, BBM4, title="RZ1", color=color.yellow, transp=90)
fill(BBM4, BBL1, title="SZ1", color=color.orange, transp=90)
fill(BBL1, BBL2, title="SZ2", color=color.red, transp=90)
fill(BBL2, BBL3, title="SZ3", color=color.maroon, transp=90)
fill(BBL3, BBL4, title="SZ4", color=color.maroon, transp=90)
fill(BBL4, BBL5, title="SZ5", color=color.maroon, transp=90)

strategy.risk.allow_entry_in(tradeDirection)
longCondition = crossover(Source[1],R1) and inDateRange
shortCondition = crossunder(Source[1], S2) and inDateRange

strategy.entry("Buy", strategy.long, when=longCondition, oca_name="oca")
strategy.entry("Sell", strategy.short, when=shortCondition, oca_name="oca")