Stratégie de rupture de momentum multi-périodes
Aperçu
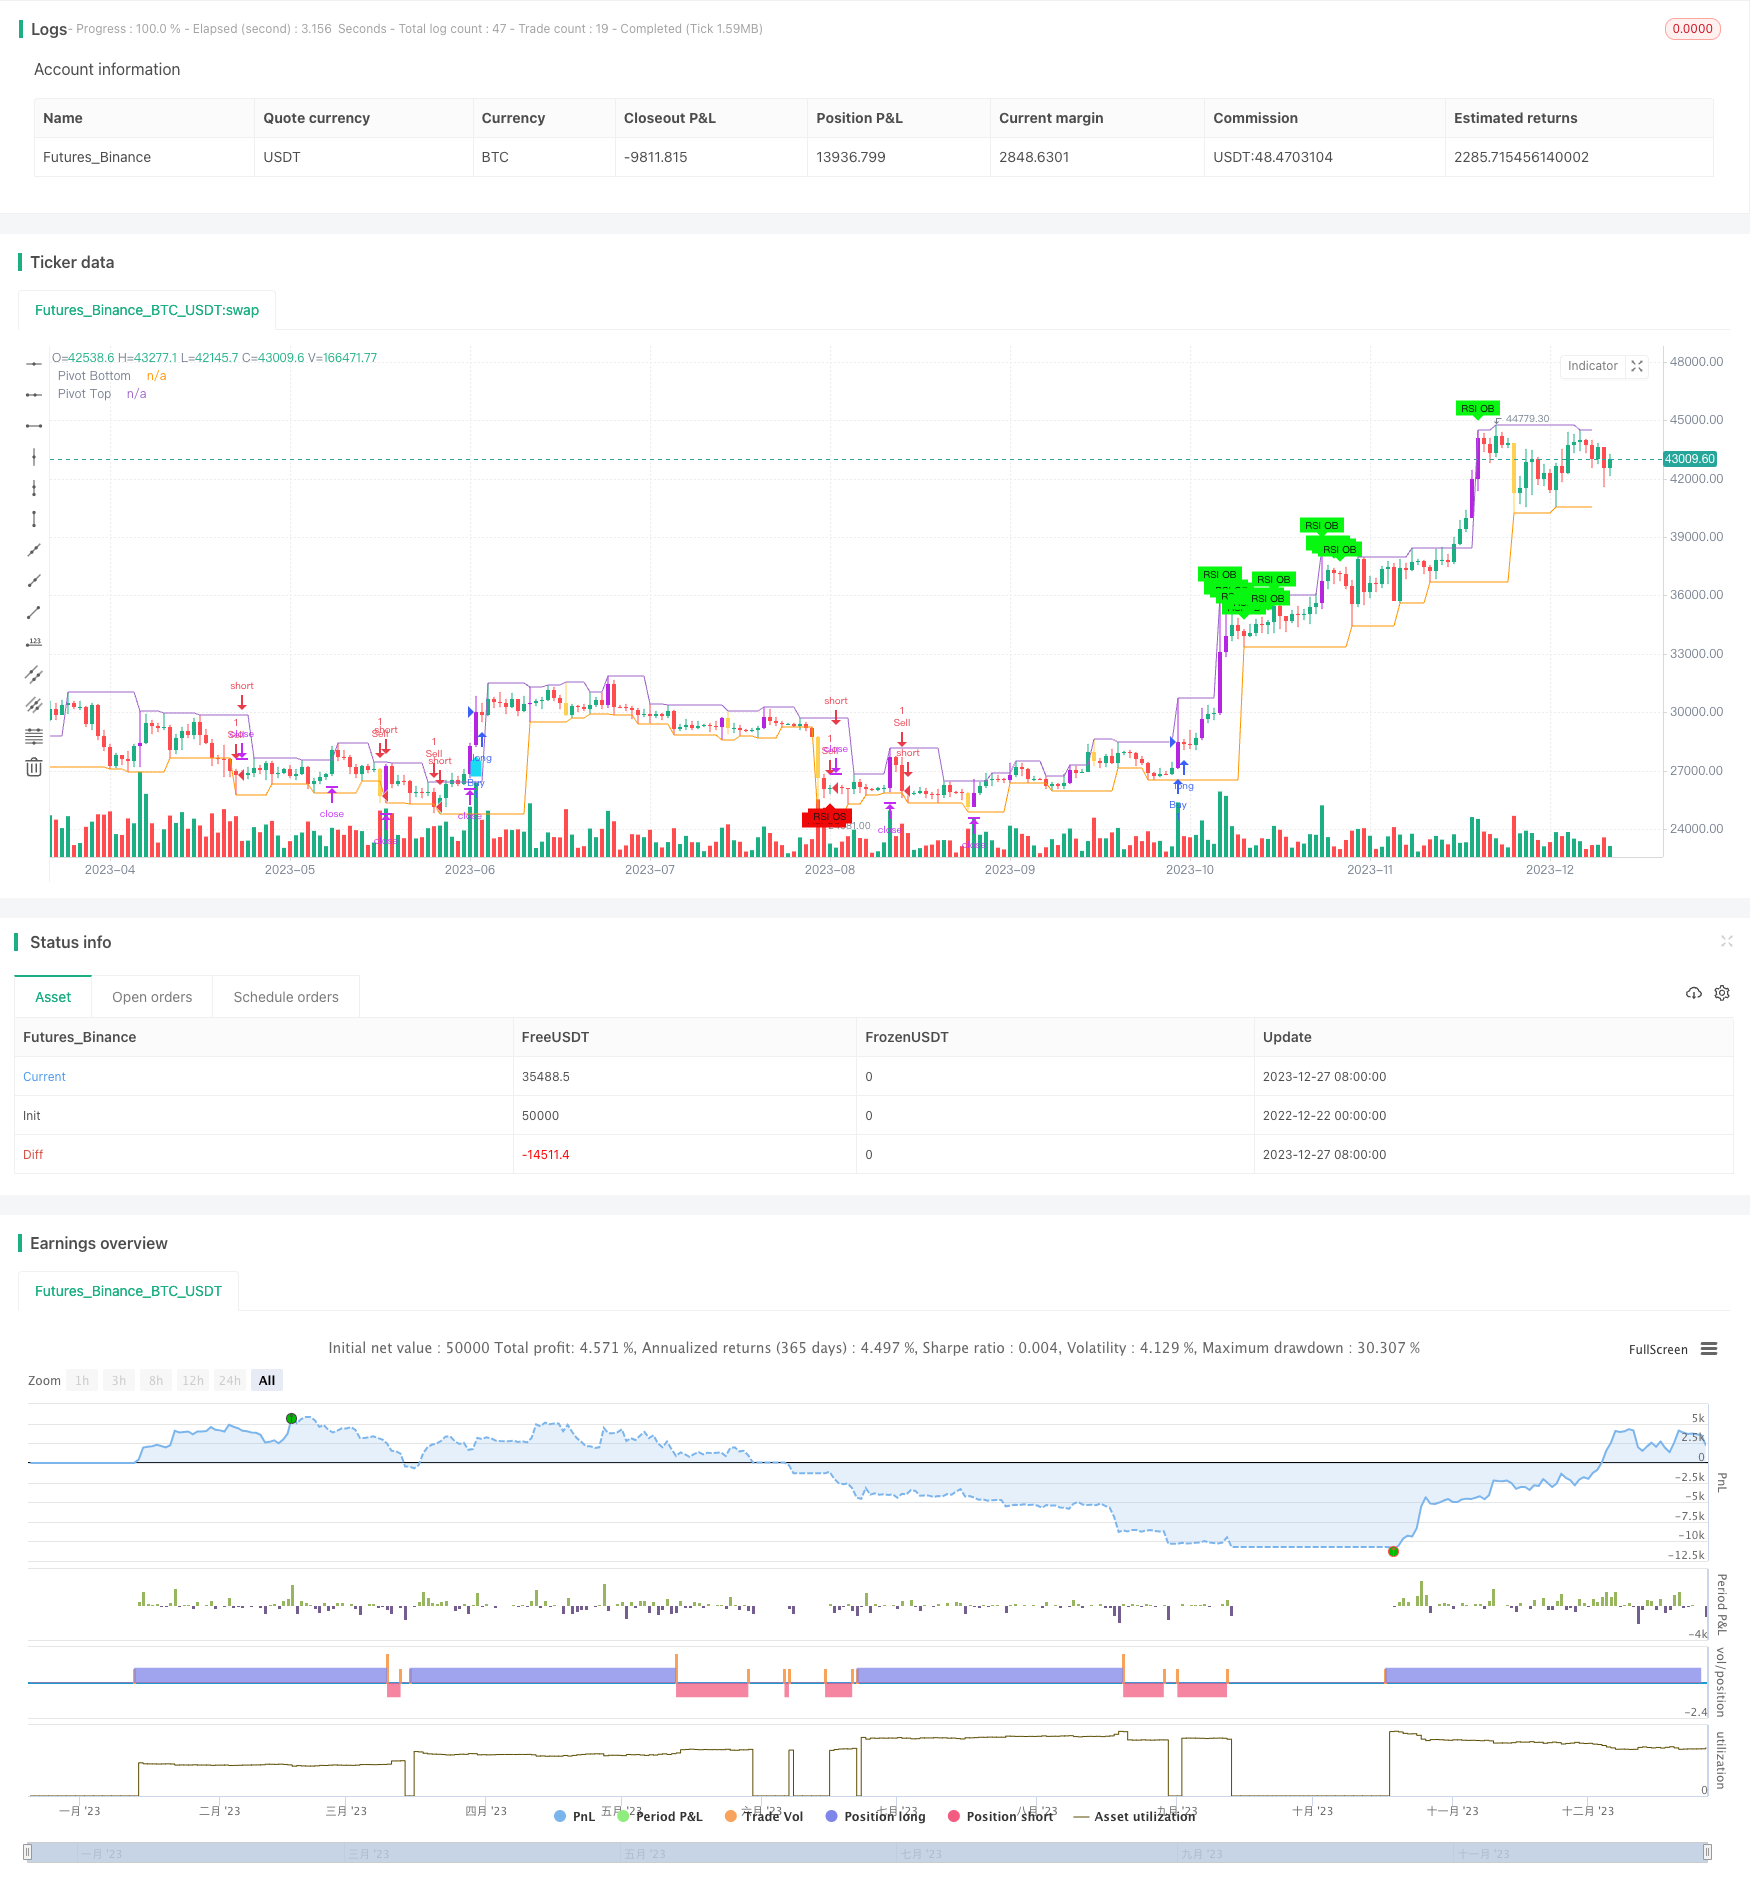
Cette stratégie permet de juger la tendance et de capturer les points de rupture en combinant plusieurs indicateurs techniques tels que le RSI, l’ADX, l’ATR et l’indicateur de dynamique. La stratégie est également combinée avec la ligne de rétraction et la ligne de moyenne de Fibonacci, ce qui améliore encore la précision des jugements sur les points critiques et les tendances.
Principe de stratégie
Les indicateurs RSI, ADX, DI+, DI- et autres permettent de déterminer la direction et la force d’une tendance. Le RSI peut refléter des situations de survente et de survente, l’ADX reflète la force d’une tendance, et le DI+/DI- permet de déterminer les tendances à la hausse et à la baisse. Les valeurs de ces indicateurs sont affichées dans le tableau en haut à droite.
L’EMA du 5e et du 9e jour est utilisée pour déterminer la tendance à court terme, l’EMA du 21e jour est utilisée pour déterminer la tendance à moyen terme et l’EMA du 60e jour est utilisée pour déterminer la tendance à long terme.
Utilisez la ligne de rétraction de Fibonacci pour trouver les points de support clés tels que 0.5, 0.618. Ces points sont souvent des points de retournement potentiels.
Le prix d’arrêt est basé sur l’ATR et le stop loss ratio pour contrôler le risque. Le prix d’arrêt est basé sur l’ATR et le stop loss ratio pour bloquer les bénéfices.
En cas de signal de RSI de sur-achat et de survente, envisagez de revenir en arrière. En cas de rupture de la moyenne à court terme, envisagez de suivre la tendance. En cas de rupture de la moyenne à moyen terme, envisagez de suivre la tendance.
Analyse des avantages
L’utilisation intégrée de plusieurs indicateurs pour déterminer la direction et la force des tendances, améliore l’exactitude des décisions.
Le dispositif d’arrêt de perte basé sur l’ATR permet de contrôler efficacement les risques.
La précision du jugement du point de basculement est améliorée en combinant les points critiques de Fibonacci.
L’augmentation du volume des transactions est une condition supplémentaire pour suivre la tendance et éviter les faux-breechers.
Les tableaux affichent les valeurs actuelles de plusieurs indicateurs, ce qui facilite le jugement et la prise de décision.
Analyse des risques
La probabilité que l’indicateur émette un signal erroné ne peut pas être complètement évitée, ce qui entraîne un risque d’erreur de traitement. Les paramètres de l’indicateur peuvent être optimisés en ajustant les paramètres.
Les réglages de l’ATR et du Stop Loss Ratio influencent le point de stop réel. Un réglage trop grand ou trop petit entraîne un certain risque et nécessite un réglage de contrepartie.
L’augmentation du volume des transactions comme condition d’entrée ne peut pas éviter complètement la survenue de fausses ruptures, mais doit être jugée en fonction des détails de la situation des prix.
Le point de Fibonacci n’est pas non plus 100% fiable, et le prix peut se briser directement à travers ce point.
Direction d’optimisation
Les paramètres RSI, ADX, ATR, etc. sont testés et optimisés pour trouver la meilleure combinaison de paramètres.
Testez différentes combinaisons de lignes de moyenne pour déterminer quelles combinaisons de moyenne sont les plus efficaces pour déterminer l’effet de la tendance.
Tester différents paramètres de stop loss et stop loss pour trouver le paramètre le plus adapté au risque et au rendement.
On peut envisager d’inclure l’indicateur BollingerBands pour juger de l’effet de l’augmentation du volume des transactions.
Résumer
Cette stratégie utilise un large éventail de techniques, telles que le jugement de la tendance, le jugement des points clés, l’analyse du volume des transactions. L’optimisation des paramètres améliore encore l’exactitude et la rentabilité du jugement. Le paramètre de stop-loss contrôle le risque et maximise les gains.
/*backtest
start: 2022-12-22 00:00:00
end: 2023-12-28 00:00:00
period: 1d
basePeriod: 1h
exchanges: [{"eid":"Futures_Binance","currency":"BTC_USDT"}]
*/

// This source code is subject to the terms of the Mozilla Public License 2.0 at https://mozilla.org/MPL/2.0/
// © amit74sharma135

//@version=5

strategy(" KritikSharma Strategy for NIFTY,BNIFTY,NG,CRUDE,WTICrude,BTC,GOLD,SILVER,COPPER", overlay=true)
plotHVB = input.bool(defval=true, title='Plot HVB')
plotPVT = input.bool(defval=false, title='Plot Pivots')
hvbEMAPeriod = input.int(defval=12, minval=1, title='Volume EMA Period')
hvbMultiplier = input.float(defval=1.5, title='Volume Multiplier')
pivotLookup = input.int(defval=2, minval=1, maxval=15, title='Pivot Lookup')
ShowAvg1 = input(false, title="Show trend line", group="TREND LINE Moving Average", tooltip="Display a trend line based on EMA.")
showLines1 = input.bool(defval=false, title="Draw EMA,WMA Line")
ema200_length= input.int(defval=200, minval=1, maxval=500, title='ema1')
ema300_length= input.int(defval=300, minval=1, maxval=500, title='ema2')
wma60_length= input.int(defval=60, minval=1, maxval=100, title='wma60')
ema5 = ta.ema(close, 5)
ema9 = ta.ema(close, 9)
wma21=ta.wma(close,21)
wma60=ta.wma(close,wma60_length)
len1 = input.int(11, minval=1, maxval=500, title="Length", group="TREND LINE Moving Average", tooltip="Set EMA length.")
ema=ta.ema(close, len1)
rsiLength = input.int(14, title="RSI Length", minval=1, maxval=50, group="Table ADX, RSI, DI values with Red, Green, Yellow Signal")
adxLength = input.int(14, title="ADX Length", minval=1, maxval=50, group="Table ADX, RSI, DI values with Red, Green, Yellow Signal")
adxThreshold = input.int(20, title="ADX Threshold", group="Table ADX, RSI, DI values with Red, Green, Yellow Signal")
diThreshold = input.int(25, title="DI Threshold", group="Table ADX, RSI, DI values with Red, Green, Yellow Signal")
atr = input.int(14, title="ATR values", group="Table ADX, RSI, DI values with Red, Green, Yellow Signal")
////////////////////////////////////////////////

hvbBullColor = color.rgb(181, 37, 225)
hvbBearColor = #ffbb00ad

pvtTopColor = color.new(#154bef, 0)
pvtBottomColor = color.new(#b81657, 0)

//////////////////// Pivots ////////////////////
hih = ta.pivothigh(high, pivotLookup, pivotLookup)
lol = ta.pivotlow(low , pivotLookup, pivotLookup)
top1 = ta.valuewhen(hih, high[pivotLookup], 0)
bottom1 = ta.valuewhen(lol, low [pivotLookup], 0)
plot(top1, offset=-pivotLookup, linewidth=1, color=(top1 != top1[1] ? na : (plotPVT ? pvtTopColor : na)), title="Pivot Top")
plot(bottom1, offset=-pivotLookup, linewidth=1, color=(bottom1 != bottom1[1] ? na : (plotPVT ? pvtBottomColor : na)), title="Pivot Bottom")

//////////////////////////////////////Functions
isUp(index) =>
    close[index] > open[index]

isDown(index) =>
    close[index] < open[index]

isObUp(index) =>
    isDown(index + 1) and isUp(index) and close[index] > high[index + 1]

isObDown(index) =>
    isUp(index + 1) and isDown(index) and close[index] < low[index + 1]
////////////////// High Volume Bars //////////////////
volEma = ta.ema(volume, hvbEMAPeriod)
isHighVolume = volume > (hvbMultiplier * volEma)
barcolor(plotHVB and isUp(0) and isHighVolume ? hvbBullColor : na, title="Bullish HVB")
barcolor(plotHVB and isDown(0) and isHighVolume ? hvbBearColor : na, title="Bearish HVB")

// Calculate ADX, DI+,  DI-,RSI,ATR
[diplus, diminus, adx] = ta.dmi(adxLength, adxThreshold)
rsi=ta.rsi(close,rsiLength)
atrValue=ta.atr(atr)

// Check for oversold,Overbought condition
oversold_condition = rsi < 20
overbought_condition = rsi > 80

// Plot Trend Line
trendColor = ema5 > ema9 ? color.rgb(22, 203, 28) : ema5 < ema9 ? color.rgb(224, 15, 15) : na
plot(ShowAvg1? ema:na, color=trendColor, linewidth=6, title="Trend Line Upper Ribbon")

/////////////////////////plot ema,wma
plot(showLines1 ? ta.ema(close, ema200_length) : na, color=color.rgb(102, 110, 103), style=plot.style_line, title="ema1",linewidth = 4)
plot(showLines1 ? ta.ema(close, ema300_length) : na, color=color.rgb(18, 20, 18), style=plot.style_line, title="ema2",linewidth = 4)
plot(showLines1 ? ta.wma(close, wma60_length) : na, color=color.rgb(238, 75, 211), style=plot.style_line, title="wma60",linewidth = 3)

// Plot signals with smaller text
plotshape(oversold_condition ? 1 : na, title="RSI Oversold Signal", color=color.rgb(238, 8, 8), style=shape.labelup, location=location.belowbar, text="RSI OS", textcolor=color.rgb(17, 17, 17), size=size.tiny)
plotshape(overbought_condition ? 1 : na, title="RSI Overbought Signal", color=#08f710, style=shape.labeldown, location=location.abovebar, text="RSI OB", textcolor=color.rgb(8, 8, 8), size=size.tiny)
///////////////////////////////////////////////////////////////////////////////////////////////

// Define input options
showTable = input(false, title="Show Table ADX, RSI, DI values with RED, GREEN and YELLOW Signal")
tablePosition = input.string("Top Right", title="Table Position", options=["Top Right", "Top Left", "Top Center", "Bottom Right", "Bottom Left", "Bottom Center"])

// Define colors for the table cells
colorRsi = rsi > 55 ? color.green : rsi < 45 ? color.red : color.yellow
colorDiPlus = diplus > diThreshold ? color.green : color.red
colorDiMinus = diminus > diThreshold ? color.red : color.green
colorAdx = (rsi < 45 and diplus < diThreshold and diminus > diThreshold and adx > adxThreshold) ? color.red :
           (rsi > 55 and diplus > diThreshold and diminus < diThreshold and adx > adxThreshold) ? color.green :
           color.yellow

// Create the table
var table testTable = na
if showTable
    var position = tablePosition == "Top Right" ? position.top_right :
                   tablePosition == "Top Left" ? position.top_left :
                   tablePosition == "Top Center" ? position.top_center :
                   tablePosition == "Bottom Right" ? position.bottom_right :
                   tablePosition == "Bottom Left" ? position.bottom_left :
                   position.bottom_center

    testTable := table.new(position, columns = 4, rows = 2, border_width = 1, border_color = color.black, frame_width = 1, frame_color = color.black)

    // Column Headings
    table.cell(table_id = testTable, column = 0, row = 0, text = " DI+ ", bgcolor=color.aqua, text_color = color.white)
    table.cell(table_id = testTable, column = 1, row = 0, text = " DI- ", bgcolor=color.aqua, text_color = color.white)
    table.cell(table_id = testTable, column = 2, row = 0, text = " ADX ", bgcolor=color.aqua, text_color = color.white)
    table.cell(table_id = testTable, column = 3, row = 0, text = " RSI ", bgcolor=color.aqua, text_color = color.white)

    // Column values
    table.cell(table_id = testTable, column = 0, row = 1, text = str.tostring(math.round(diplus, 0)), bgcolor=colorDiPlus, text_color = color.black)
    table.cell(table_id = testTable, column = 1, row = 1, text = str.tostring(math.round(diminus, 0)), bgcolor=colorDiMinus, text_color = color.black)
    table.cell(table_id = testTable, column = 2, row = 1, text = str.tostring(math.round(adx, 0)), bgcolor=colorAdx, text_color = color.black)
    table.cell(table_id = testTable, column = 3, row = 1, text = str.tostring(math.round(rsi, 0)), bgcolor=colorRsi, text_color = color.black)


// Initialize variables to keep track of the previous condition
var bool prev_oversold = na
var bool prev_overbought = na

plotshape(ta.crossover(ema,wma60) and isHighVolume,  style=shape.labelup, location=location.belowbar, color=#1adaf3,size=size.small)
plotshape(ta.crossunder(ema,wma60) and isHighVolume,  style=shape.labeldown, location=location.abovebar, color=#f30aa9, size=size.small)
//////////////////////////////////////////////////
plotFibRetracement = input.bool(title="Plot Fibonacci Retracement", defval=false)
fibLevel1 = input.float(title="Fibonacci Level", defval=0.5, minval=0, maxval=1, step=0.01)
fibLevel2 = input.float(title="Fibonacci Level", defval=0.618, minval=0, maxval=1, step=0.01)
fibLevel3 = input.float(title="Fibonacci Level", defval=0.368, minval=0, maxval=1, step=0.01)
// Calculate Fibonacci Levels
highPrice = ta.highest(high, 100)
lowPrice = ta.lowest(low, 100)
priceRange = highPrice - lowPrice
fibonacciLevel1 = lowPrice + priceRange * fibLevel1
fibonacciLevel2 = lowPrice + priceRange * fibLevel2
fibonacciLevel3 = lowPrice + priceRange * fibLevel3

// Plot Fibonacci Levels
if plotFibRetracement
    line.new(x1=bar_index[1], y1=fibonacciLevel1, x2=bar_index, y2=fibonacciLevel1, color=color.blue, width=2)
    line.new(x1=bar_index[1], y1=fibonacciLevel2, x2=bar_index, y2=fibonacciLevel2, color=color.blue, width=2)
    line.new(x1=bar_index[1], y1=fibonacciLevel3, x2=bar_index, y2=fibonacciLevel3, color=color.blue, width=2)
// Draw Trendline
var float trendlineY1 = na
var float trendlineY2 = na

if bar_index % 50 == 0
    trendlineY1 := low
    trendlineY2 := high

// line.new(x1=bar_index, y1=trendlineY1, x2=bar_index - 100, y2=trendlineY2, color=#3708a5, width=2)

////////////////////////////////////////////////entry, exit, profit booking, stoploss///////////////////////
if (rsi > 63 and adx> adxThreshold and diplus>diThreshold)
    strategy.entry("Buy", strategy.long, qty = 1)

if (rsi < 40 and adx> adxThreshold and diminus>diThreshold)
    strategy.entry("Sell", strategy.short, qty = 1)

// Set stop loss and take profit levels
stop_loss = input(1.5, title = "Stop Loss (%)") * atrValue
take_profit = input(4.0, title = "Take Profit (%)") * atrValue
strategy.exit("Take Profit/Stop Loss", from_entry = "Buy", stop = close - stop_loss, limit = close + take_profit)
strategy.exit("Take Profit/Stop Loss", from_entry = "Sell", stop = close + stop_loss, limit = close - take_profit)
////////////////////////