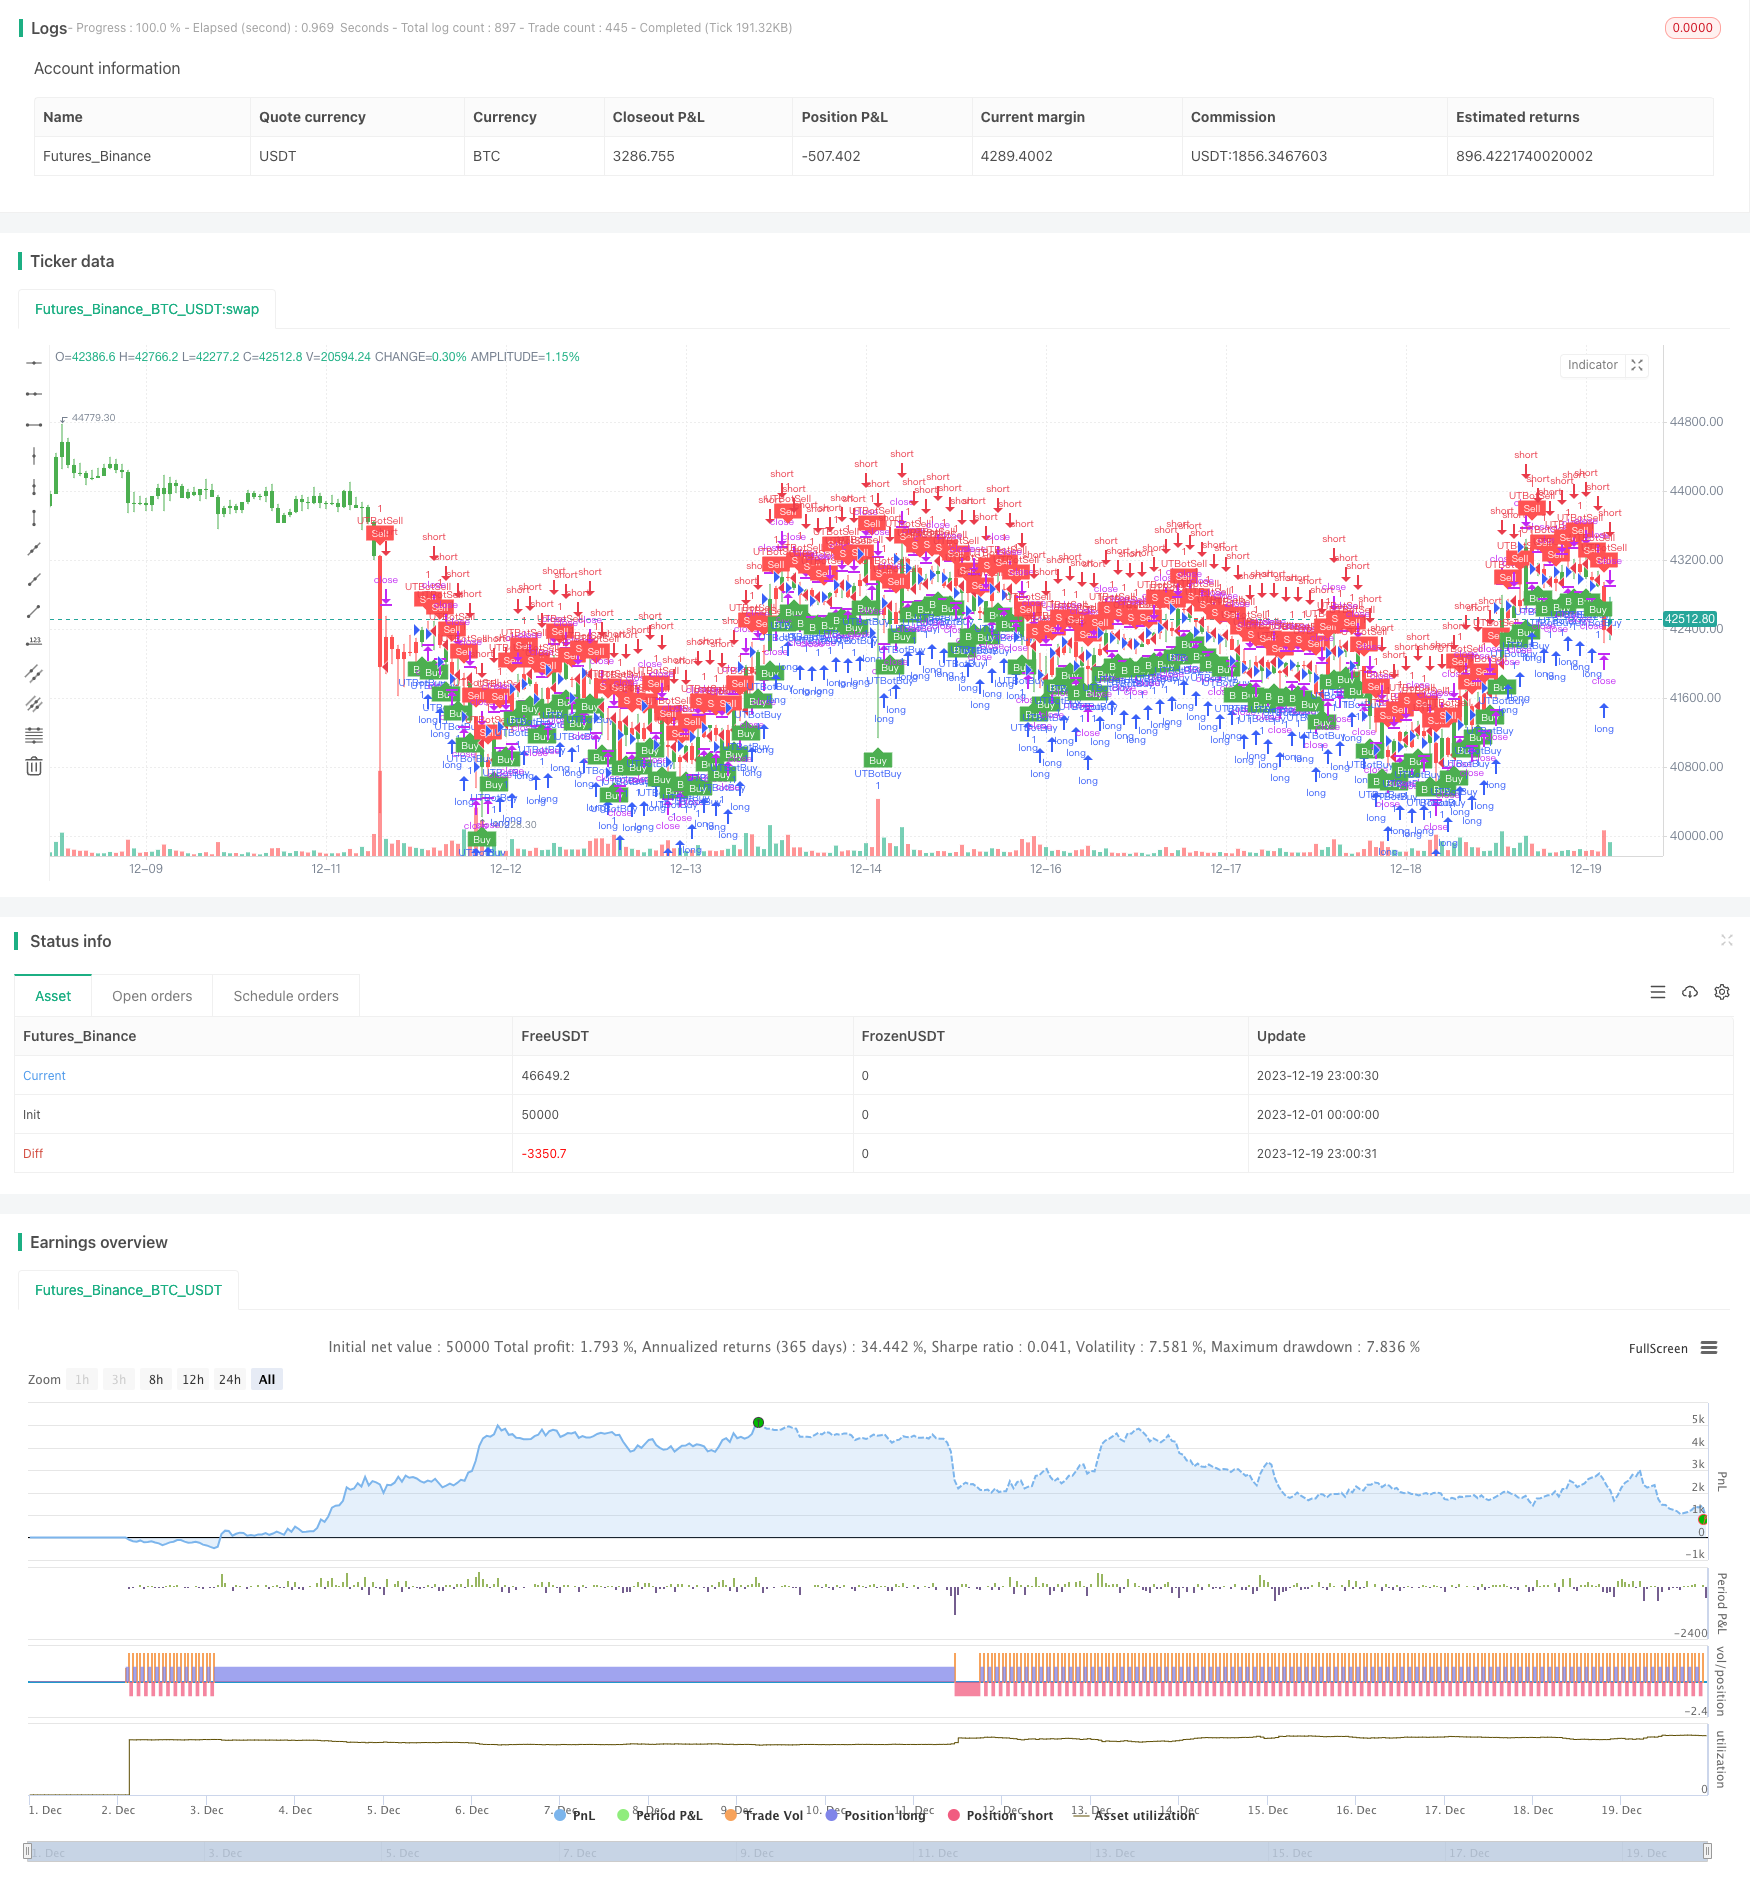
Stratégie de suivi de tendance adaptative par stop suiveur basée sur l'ATR et le RSI

Aperçu
Cette stratégie utilise une combinaison d’une gamme de fluctuations réelles moyennes (ATR), d’un indice de force relative (RSI) et d’un stop-loss mobile pour réaliser un suivi de tendance adaptatif. Le stop-loss dynamique est calculé par l’ATR, le RSI est utilisé pour déterminer la direction de la tendance du marché, et le stop-loss mobile suit les fluctuations des prix pour maximiser les bénéfices.
Principe de stratégie
Calculer l’ATR. L’ATR reflète la volatilité du marché et le niveau de risque. La stratégie utilise l’ATR pour calculer le stop loss dynamique et réaliser un stop loss adaptatif.
Calculer le RSI. Le RSI permet de déterminer si le marché est en sur-achat ou en sur-vente. Le RSI est un signe de hausse si le RSI est supérieur à 50 et un signe de baisse si le RSI est inférieur à 50.
Suivi des arrêts mobiles. Cette stratégie permet de suivre les fluctuations des prix en permanence en fonction des arrêts mobiles calculés par l’ATR et de la direction de la tendance jugée par le RSI.
Plus précisément, lorsque le RSI est supérieur à 50, il est possible d’ouvrir une position en plus et une position en moins. Le prix d’arrêt est ensuite calculé à l’aide de l’ATR pour suivre les fluctuations des prix.
Analyse des avantages
L’ATR permet de réaliser des arrêts adaptatifs et d’ajuster la marge de stop en fonction de la dynamique de la volatilité du marché, afin d’éviter des arrêts trop importants et trop petits.
Le RSI est un indicateur fiable pour déterminer la direction de la tendance et éviter d’être pris au piège dans un marché instable.
Le stop mobile suit les fluctuations des prix, ce qui permet d’étendre le stop et de suivre pleinement la tendance.
Analyse des risques
Les paramètres ATR et RSI doivent être optimisés par des tests de retour, sinon cela affectera l’efficacité de la stratégie.
Bien qu’il y ait une protection contre les pertes, il est difficile d’éviter le risque que les pertes soient dépassées. La position peut être réduite de manière appropriée pour contrôler le risque.
Les stratégies dépendent beaucoup de la variété de la transaction pour optimiser les paramètres, ce qui nécessite d’ajuster les paramètres pour les différentes variétés.
Direction d’optimisation
On peut envisager d’ajouter des algorithmes d’apprentissage automatique pour optimiser l’adaptation des paramètres.
L’ajout d’un module de contrôle de position permet de modifier la taille de la position en fonction de la dynamique du marché, ce qui réduit la probabilité de rupture de la clôture.
Il est important d’augmenter les indicateurs de jugement de tendance pour éviter les pertes dues à la perte d’un point de basculement.
Résumer
Cette stratégie intègre l’utilisation de modules tels que l’ATR, le RSI et le stop-loss mobile, formant une stratégie de suivi de tendance auto-adaptative typique. L’optimisation des paramètres permet une grande flexibilité pour s’adapter aux différentes variétés de transactions, et est une stratégie de suivi de tendance générale recommandée. L’efficacité de cette stratégie peut être encore améliorée en ajoutant plus de jugements d’indicateurs et en optimisant les algorithmes d’apprentissage automatique.
/*backtest
start: 2023-12-01 00:00:00
end: 2023-12-19 23:59:59
period: 1h
basePeriod: 15m
exchanges: [{"eid":"Futures_Binance","currency":"BTC_USDT"}]
*/

//@version=2
strategy(title="UTBot Strategy", overlay = true )

// CREDITS to @HPotter for the orginal code.
// CREDITS to @Yo_adriiiiaan for recently publishing the UT Bot study based on the original code -
// CREDITS to @TradersAITradingPlans for making this Strategy.
// Strategy fixed with Time period by Kirk65.
// I am using this UT bot with 2 hours time frame with god resultss. Alert with "Once per bar" and stoploss 1.5%. If Alerts triggered and price goes against Alert. Stoploss will catch it. Wait until next Alert.
// While @Yo_adriiiiaan mentions it works best on a 4-hour timeframe or above, witch is a lot less risky, but less profitable.

testStartYear = input(2019, "BACKTEST START YEAR", minval = 1980, maxval = 2222)
testStartMonth = input(01, "BACKTEST START MONTH", minval = 1, maxval = 12)
testStartDay = input(01, "BACKTEST START DAY", minval = 1, maxval = 31)
testPeriodStart = timestamp(testStartYear,testStartMonth,testStartDay,0,0)
testStopYear = input(2222, "BACKTEST STOP YEAR", minval=1980, maxval = 2222)
testStopMonth = input(12, "BACKTEST STOP MONTH", minval=1, maxval=12)
testStopDay = input(31, "BACKTEST STOP DAY", minval=1, maxval=31)
testPeriodStop = timestamp(testStopYear, testStopMonth, testStopDay, 0, 0)

testPeriod = true

SOURCE = input(hlc3)
RSILENGTH = input(14, title = "RSI LENGTH")
RSICENTERLINE = input(52, title = "RSI CENTER LINE")
MACDFASTLENGTH = input(7, title = "MACD FAST LENGTH")
MACDSLOWLENGTH = input(12, title = "MACD SLOW LENGTH")
MACDSIGNALSMOOTHING = input(12, title = "MACD SIGNAL SMOOTHING")
a = input(10, title = "Key Vaule. 'This changes the sensitivity'")
SmoothK = input(3)
SmoothD = input(3)
LengthRSI = input(14)
LengthStoch = input(14)
RSISource = input(close)
c = input(10, title="ATR Period")
xATR = atr(c)
nLoss = a * xATR
xATRTrailingStop = iff(close > nz(xATRTrailingStop[1], 0) and close[1] > nz(xATRTrailingStop[1], 0), max(nz(xATRTrailingStop[1]), close - nLoss),
     iff(close < nz(xATRTrailingStop[1], 0) and close[1] < nz(xATRTrailingStop[1], 0), min(nz(xATRTrailingStop[1]), close + nLoss),
     iff(close > nz(xATRTrailingStop[1], 0), close - nLoss, close + nLoss)))
pos =	iff(close[1] < nz(xATRTrailingStop[1], 0) and close > nz(xATRTrailingStop[1], 0), 1,
     iff(close[1] > nz(xATRTrailingStop[1], 0) and close < nz(xATRTrailingStop[1], 0), -1, nz(pos[1], 0)))
color = pos == -1 ? red: pos == 1 ? green : blue
ema= ema(close,1)
above = crossover(ema,xATRTrailingStop )
below = crossover(xATRTrailingStop,ema)
buy = close > xATRTrailingStop and above
sell = close < xATRTrailingStop and below
barbuy = close > xATRTrailingStop
barsell = close < xATRTrailingStop
plotshape(buy, title = "Buy", text = 'Buy', style = shape.labelup, location = location.belowbar, color= green,textcolor = white, transp = 0, size = size.tiny)
plotshape(sell, title = "Sell", text = 'Sell', style = shape.labeldown, location = location.abovebar, color= red,textcolor = white, transp = 0, size = size.tiny)
barcolor(barbuy? green:na)
barcolor(barsell? red:na)
//alertcondition(buy, title='Buy', message='Buy')
//alertcondition(sell, title='Sell', message='Sell')

if (buy)
    strategy.entry("UTBotBuy",strategy.long, when=testPeriod)
if (sell)
    strategy.entry("UTBotSell",strategy.short, when=testPeriod)