Stratégie de suivi de tendance du canal de prix à moyenne mobile double
Aperçu
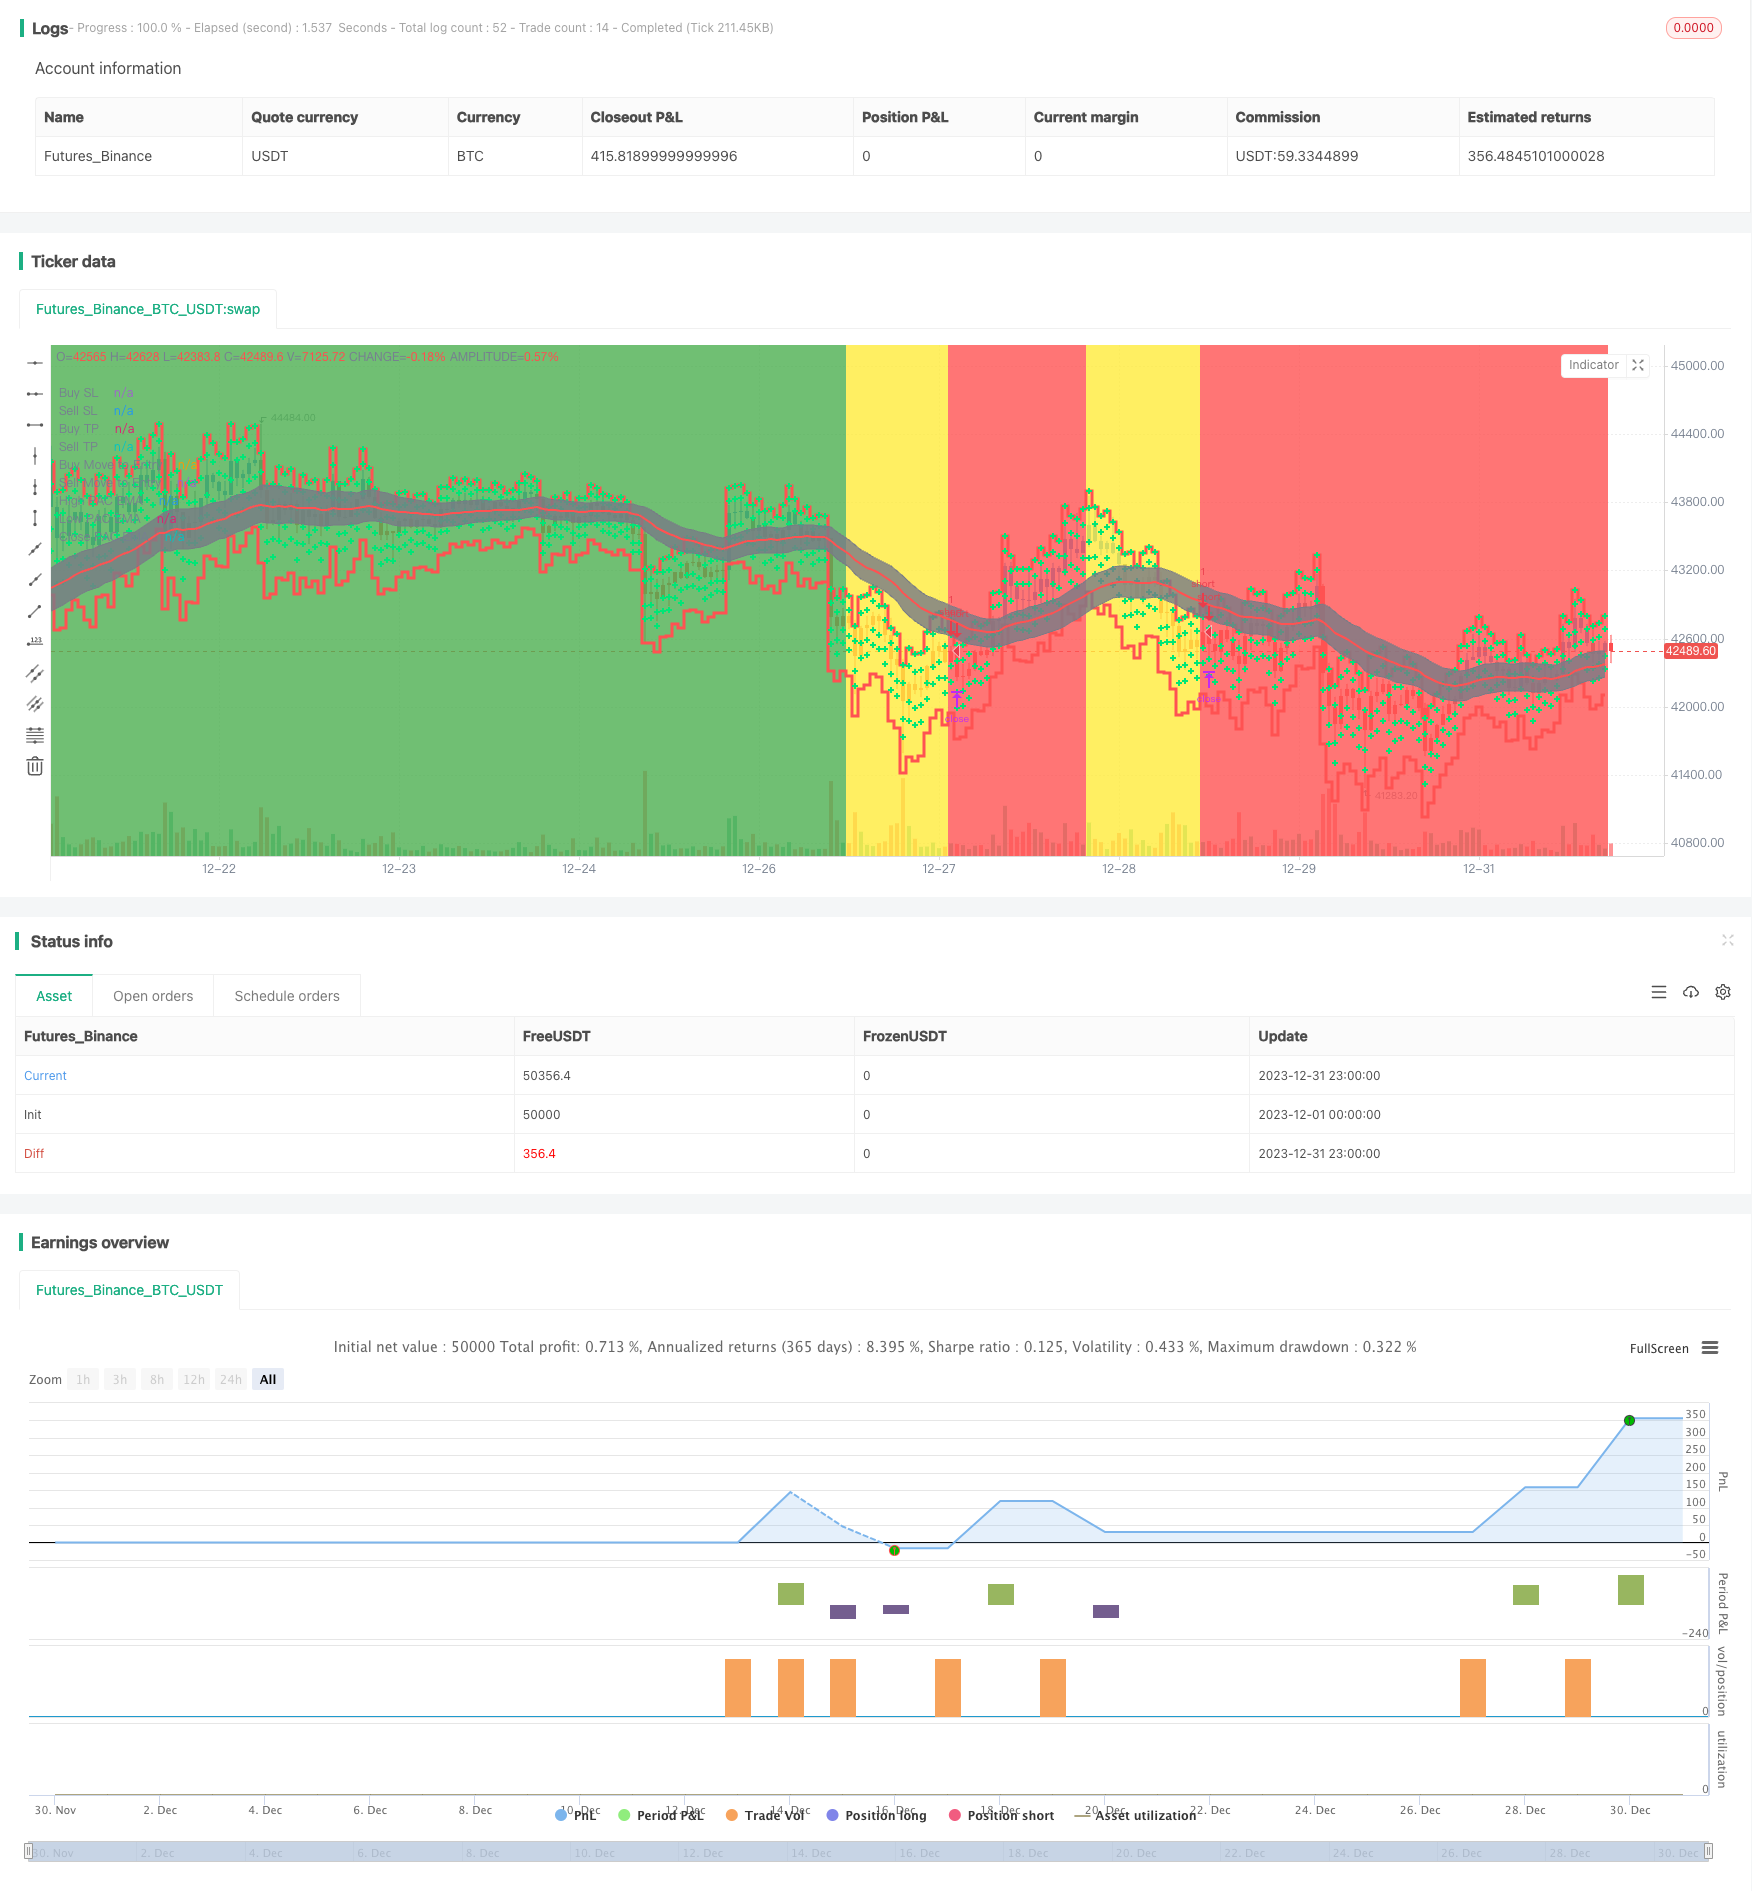
La stratégie est basée sur la construction d’une chaîne de prix à double ligne droite, l’utilisation d’une gamme de chaînes pour juger de la direction de la tendance des prix et la définition d’un suivi de la tendance des arrêts de perte pour localiser les bénéfices.
Principe de stratégie
La stratégie de canal de prix à double ligne moyenne utilise un canal de prix à base d’EMA rapide et un canal de prix à base d’EMA lente. Le paramètre de l’EMA rapide est de 89 cycles et le paramètre de l’EMA lente est de 200 cycles.
Une tendance à la hausse est jugée lorsque l’EMA rapide est supérieure à l’EMA lente et que le prix est inférieur à la descente; une tendance à la baisse est jugée lorsque l’EMA rapide est inférieure à l’EMA lente et que le prix est supérieur à la descente.
Dans une tendance à la hausse, la stratégie fait un short pour déterminer un renversement de tendance; dans une tendance à la baisse, la stratégie fait plus pour déterminer un renversement de tendance.
En outre, la stratégie est dotée d’une fonction de suivi des arrêts. Après la tenue de la position, le prix de suivi des arrêts est mis à jour en temps réel, ce qui permet de verrouiller les bénéfices.
Analyse des avantages
Le plus grand avantage de cette stratégie réside dans l’utilisation d’une courbe de prix de construction de la courbe de prix de construction de la courbe de prix de construction de la courbe de prix de construction de la courbe de prix de construction de la courbe de prix de construction de la courbe de prix de construction de la courbe de prix de construction de la courbe de prix de construction de la courbe de prix de construction de la courbe de prix de construction de la courbe de construction de la courbe de prix de construction de la courbe de construction de la courbe de construction de la courbe de construction de la courbe de construction de la courbe de construction de la courbe de construction de la courbe de construction de la courbe de construction de la courbe de construction de la courbe de construction de la courbe de construction de la courbe de construction de la courbe de construction de la courbe.
D’autres avantages sont: un grand espace d’optimisation des paramètres, permettant d’ajuster les paramètres pour différentes variétés et périodes; mise à jour en temps réel du prix d’arrêt, faible risque d’opération.
Analyse des risques
Le principal risque de cette stratégie est que le signal de renversement ne soit pas très efficace, ce qui peut entraîner des erreurs de jugement. Dans ce cas, il faut optimiser les paramètres pour s’assurer que l’effet du renversement de tendance est déterminé.
En outre, la configuration du point d’arrêt est également essentielle. Un point d’arrêt trop grand peut entraîner un point d’arrêt insuffisamment décisif; un point d’arrêt trop petit peut entraîner un point d’arrêt excessif. Cela doit être ajusté en fonction des variétés.
Enfin, les problèmes de données peuvent également entraîner l’échec de la stratégie. Assurez-vous que des données historiques fiables, continues et suffisantes sont utilisées pour les stratégies de retestement et de vérification en laboratoire.
Direction d’optimisation
L’optimisation de la stratégie s’est principalement concentrée sur les aspects suivants:
Les cycles des EMA rapides et des EMA lentes peuvent être optimisés, en définissant différentes combinaisons de paramètres pour juger de l’efficacité
Les paramètres de montée et de descente du canal de prix peuvent également être ajustés pour rechercher des paramètres cycliques plus appropriés
Le paramétrage des points d’arrêt est essentiel pour tester différents paramètres afin d’optimiser la stratégie d’arrêt
On peut tester l’introduction d’autres indicateurs pour déterminer le renversement de la tendance et améliorer l’effet de la monotonie.
Résumer
Cette stratégie fonctionne de manière rationnelle et fluide, en utilisant un canal bi-linéaire pour déterminer la direction de la tendance et en bloquant les bénéfices avec un stop-loss mobile. C’est une stratégie de suivi de tendance plus stable. Grâce à l’optimisation des paramètres et à l’optimisation des réglages de ventilation, cette stratégie peut devenir l’une des stratégies de trading quantitatif les plus efficaces.
/*backtest
start: 2023-12-01 00:00:00
end: 2023-12-31 23:59:59
period: 1h
basePeriod: 15m
exchanges: [{"eid":"Futures_Binance","currency":"BTC_USDT"}]
*/

//@version=4
strategy("Trend trader Strategy", overlay=true)

//f you want to trade shallower Pullbacks for quicker scalps, try reducing the
//    PAC and EMA combination lengths for example:
//      * 21 PAC and 55, 144, 377 for fast, medium, slow EMAs
//      * 13 PAC and 34, 89, 233 for fast, medium, slow EMAs
//  - Each alert should be evaluated on it's own merits, the alerts are designed to highlight possible
//    scalping trades from Pullback recoveries around the PAC.

fromDay = input(defval = 1, title = "From Day", minval = 1, maxval = 31)
fromMonth = input(defval = 6, title = "From Month", minval = 1, maxval = 12)
fromYear = input(defval = 2020, title = "From Year", minval = 1970)

// To Date Inputs
toDay = input(defval = 1, title = "To Day", minval = 1, maxval = 31)
toMonth = input(defval = 12, title = "To Month", minval = 1, maxval = 12)
toYear = input(defval = 2020, title = "To Year", minval = 1970)

isMon() => dayofweek(time('D')) == dayofweek.monday
isTue() => dayofweek(time('D')) == dayofweek.tuesday
isWed() => dayofweek(time('D')) == dayofweek.wednesday
isThu() => dayofweek(time('D')) == dayofweek.thursday
isFri() => dayofweek(time('D')) == dayofweek.friday

// Calculate start/end date and time condition
DST = 1 //day light saving for usa
//--- Europe
London = iff(DST==0,"0000-0900","0100-1000")
//--- America
NewYork = iff(DST==0,"0400-1400","0500-1500")
//--- Pacific
Sydney = iff(DST==0,"1300-2200","1400-2300")
//--- Asia
Tokyo = iff(DST==0,"1500-2400","1600-0100")

customTime =iff(DST==0,"2300-1500","2400-1600")
customTime2 =iff(DST==0,"0800-1500","0900-1600")

//-- Time In Range
timeinrange(res, sess) => time(res, sess) != 0

london = timeinrange(timeframe.period, London)
newyork = timeinrange(timeframe.period, NewYork)
c_time = timeinrange(timeframe.period,customTime)
c_time2 = timeinrange(timeframe.period,customTime2)

startDate = timestamp(fromYear, fromMonth, fromDay, 00, 00)
finishDate = timestamp(toYear, toMonth, toDay, 00, 00)
time_cond = time >= startDate and time <= finishDate and (london or newyork)


    // === INPUTS ===
HiLoLen         = input(34, minval=2, title="High Low PAC channel Length")
fastEMAlength   = input(89, minval=2)
mediumEMAlength = input(200, minval=2)
slowEMAlength   = input(600, minval=2)
ShowFastEMA     = input(false)
ShowMediumEMA   = input(false)
ShowSlowEMA     = input(false)
ShowHHLL        = input(false)
ShowFractals    = input(false)
filterBW        = input(false, title="Show Ideal Fractals Only")
ShowBarColor    = input(true, title="Show coloured Bars around PAC")
ShowBuySell     = input(false, title="Show Buy/Sell Alert Arrows")
Lookback        = input(3, minval=1, title="Pullback Lookback for PAC Cross Check")
DelayArrow      = input(false, title="Show Alert Arrows Only on Closed Candles")
Delay           = DelayArrow ? 1 : 0
ShowTrendBGcolor= input(true)
UseHAcandles    = input(false, title="Use Heikin Ashi Candles in Algo Calculations")
//
// === /INPUTS ===

// === BASE FUNCTIONS ===

haClose = UseHAcandles ? security(heikinashi(syminfo.tickerid), timeframe.period, close) : close
haOpen  = UseHAcandles ? security(heikinashi(syminfo.tickerid), timeframe.period, open) : open
haHigh  = UseHAcandles ? security(heikinashi(syminfo.tickerid), timeframe.period, high) : high
haLow   = UseHAcandles ? security(heikinashi(syminfo.tickerid), timeframe.period, low) : low


//  ||---   Fractal Recognition Functions:  ---------------------------------------------------------------||
isRegularFractal(mode) =>
    ret = mode == 1 ? high[4] < high[3] and high[3] < high[2] and high[2] > high[1] and
       high[1] > high[0] : mode == -1 ?
       low[4] > low[3] and low[3] > low[2] and low[2] < low[1] and low[1] < low[0] :
       false
    ret

isBWFractal(mode) =>
    ret = mode == 1 ? high[4] < high[2] and high[3] <= high[2] and high[2] >= high[1] and
       high[2] > high[0] : mode == -1 ?
       low[4] > low[2] and low[3] >= low[2] and low[2] <= low[1] and low[2] < low[0] :
       false
    ret
//  ||-----------------------------------------------------------------------------------------------------||

//
// === /BASE FUNCTIONS ===

// === SERIES SETUP ===
//

//  ||---   Setup Moving Averages and PAC channel:
//  ||-----------------------------------------------------------------------------------------------------||
fastEMA     = ema(haClose, fastEMAlength)
mediumEMA   = ema(haClose, mediumEMAlength)
slowEMA     = ema(haClose, slowEMAlength)
pacC        = ema(haClose, HiLoLen)
pacL        = ema(haLow, HiLoLen)
pacU        = ema(haHigh, HiLoLen)
TrendDirection = fastEMA > mediumEMA and pacL > mediumEMA ? 1 :
   fastEMA < mediumEMA and pacU < mediumEMA ? -1 : 0

//  ||---   Fractal Recognition:
//  ||-----------------------------------------------------------------------------------------------------||
filteredtopf = filterBW ? isRegularFractal(1) : isBWFractal(1)
filteredbotf = filterBW ? isRegularFractal(-1) : isBWFractal(-1)
//  ||-----------------------------------------------------------------------------------------------------||
//  ||---   Higher Highs, Lower Highs, Higher Lows, Lower Lows  -------------------------------------------||
valuewhen_H0 = valuewhen(filteredtopf == true, high[2], 0)
valuewhen_H1 = valuewhen(filteredtopf == true, high[2], 1)
valuewhen_H2 = valuewhen(filteredtopf == true, high[2], 2)
//
higherhigh = filteredtopf == false ? false :
   valuewhen_H1 < valuewhen_H0 and valuewhen_H2 < valuewhen_H0
lowerhigh = filteredtopf == false ? false :
   valuewhen_H1 > valuewhen_H0 and valuewhen_H2 > valuewhen_H0
valuewhen_L0 = valuewhen(filteredbotf == true, low[2], 0)
valuewhen_L1 = valuewhen(filteredbotf == true, low[2], 1)
valuewhen_L2 = valuewhen(filteredbotf == true, low[2], 2)
//
higherlow = filteredbotf == false ? false :
   valuewhen_L1 < valuewhen_L0 and valuewhen_L2 < valuewhen_L0
lowerlow = filteredbotf == false ? false :
   valuewhen_L1 > valuewhen_L0 and valuewhen_L2 > valuewhen_L0

//
// === /SERIES ===

//
// === PLOTTING ===
//
// Plot the Price Action Channel (PAC) base on EMA high,low and close
L = plot(pacL, color=color.gray, linewidth=1, title="High PAC EMA", transp=50)
U = plot(pacU, color=color.gray, linewidth=1, title="Low PAC EMA", transp=50)
C = plot(pacC, color=color.red, linewidth=2, title="Close PAC EMA", transp=0)
fill(L, U, color=color.gray, transp=90, title="Fill HiLo PAC")

// Colour bars according to the close position relative to the PAC selected.
BARcolor = haClose > pacU ? color.blue : haClose < pacL ? color.red : color.gray
barcolor(ShowBarColor ? BARcolor : na, title="Bar Colours")
//
BGcolor = TrendDirection == 1 ? color.green :
   TrendDirection == -1 ? color.red : color.yellow
bgcolor(ShowTrendBGcolor ? BGcolor : na, transp=90, title="Trend BG Color")


// STEP 1:
// Configure trail stop level with input options (optional)
longTrailPerc = input(title="Trail Long Loss (%)",
     type=input.float, minval=0.0, step=0.05, defval=0.1) * 0.01

shortTrailPerc = input(title="Trail Short Loss (%)",
     type=input.float, minval=0.0, step=0.05, defval=0.1) * 0.01


atrRange = input(14, title="ATR Range", type=input.integer)
buyStop = input(2, title="* ATR Buy SL", type=input.float)
sellStop = input(1, title="* ATR Sell SL", type=input.float)
targetATR = input(1, title="* ATR TP1", type=input.float)
moveToEntryFigure = input(0.5, title=" move to entry in % towards target", type=input.float)

showMove = input(true, title="Show Move to Entry points")

showMoveBuycol = showMove ? color.lime : na
showMoveSellcol = showMove ? color.lime : na

// Plots

buyStopp = plot(close - atr(atrRange) * buyStop, title="Buy SL", style=plot.style_stepline, color=color.red, transp=75, linewidth=3)
sellStopp = plot(close + atr(atrRange) * sellStop, title="Sell SL", style=plot.style_stepline, color=color.red, transp=75, linewidth=3)

buyTP1 = plot(close + atr(atrRange) * targetATR, title="Buy TP", style=plot.style_cross, color=color.lime, transp=75, linewidth=3)
sellTP1 = plot(close - atr(atrRange) * targetATR, title="Sell TP", style=plot.style_cross, color=color.lime, transp=75, linewidth=3)

buyMove = plot(close + atr(atrRange) * targetATR * moveToEntryFigure, title="Buy Move to Entry", style=plot.style_cross, color=showMoveBuycol, transp=75, linewidth=3)
sellMove = plot(close - atr(atrRange) * targetATR * moveToEntryFigure, title="Sell Move to Entry", style=plot.style_cross, color=showMoveSellcol, transp=75, linewidth=3)


if barstate.isconfirmed
    if(BGcolor==color.red and BGcolor[1]==color.yellow and c_time )
        strategy.entry("short", strategy.short, comment="short", alert_message='short')
        strategy.cancel("long")
    if(BGcolor==color.green and BGcolor[1]==color.yellow and c_time )
        strategy.entry("long", strategy.long, comment="long", alert_message = 'long')
        strategy.cancel("short")


// STEP 2:
// Determine trail stop loss prices
longStopPrice = 0.0, shortStopPrice = 0.0

longStopPrice := if (strategy.position_size > 0)
    stopValue = close * (1 - longTrailPerc)
    max(stopValue, longStopPrice[1])
else
    0

shortStopPrice := if (strategy.position_size < 0)
    stopValue = close * (1 + shortTrailPerc)
    min(stopValue, shortStopPrice[1])
else
    999999

// Plot stop loss values for confirmation
plot(series=(strategy.position_size > 0) ? longStopPrice : na,
     color=color.fuchsia, style=plot.style_cross,
     linewidth=2, title="Long Trail Stop")
plot(series=(strategy.position_size < 0) ? shortStopPrice : na,
     color=color.fuchsia, style=plot.style_cross,
     linewidth=2, title="Short Trail Stop")


// STEP 3:
// Submit exit orders for trail stop loss price
//if (strategy.position_size > 0)
//    strategy.exit("XL TRL STP","long", stop=longStopPrice)

//if (strategy.position_size < 0)
//    strategy.exit("XS TRL STP","short", stop=shortStopPrice)


tp=input(0.0032,type=input.float, title="tp")
sl=input(0.001,type=input.float, title="sl")

//strategy.close("long", when= tp/2,qty_percent = 50)

//strategy.exit("longtp/sl","long",profit=tp, loss=sl, stop=longStopPrice, alert_message='closelong')
//strategy.exit("shorttp/sl","short",profit=tp, loss=sl, stop=shortStopPrice, alert_message='closeshort')

//tpatrlong= close + atr(atrRange) * targetATR
//slatrlong= close - atr(atrRange) * buyStop

//strategy.exit("longtp/sl","long",profit=tp, loss=sl, alert_message='closelong')
//strategy.exit("shorttp/sl","short",profit=tp, loss=sl, alert_message='closeshort')

strategy.exit("closelong", "long" , profit = close * tp / syminfo.mintick, loss = close * sl / syminfo.mintick, alert_message = "closelong")
strategy.exit("closeshort", "short" , profit = close * tp / syminfo.mintick, loss = close * sl / syminfo.mintick, alert_message = "closeshort")

if(BGcolor==color.yellow or not c_time)
    strategy.close("short", comment="time or yellow", alert_message='closeshort')
    strategy.close("long", comment="time or yellow", alert_message='closelong')