सुपर ट्रेंड फॉलोइंग स्टॉप लॉस रणनीति

अवलोकन
यह रणनीति ओवरट्रेंड सूचक और ट्रैक स्टॉप पर आधारित है। यह 4 अलार्मों का उपयोग शांति के लिए करता है और ओवरट्रेंड रणनीति का उपयोग करता है। यह रणनीति विशेष रूप से रोबोट के लिए डिज़ाइन की गई है, जिसमें ट्रैक स्टॉप है।
रणनीति सिद्धांत
यह रणनीति एटीआर संकेतक का उपयोग करके ट्रैक और डाउन ट्रैक की गणना करती है। जब समापन मूल्य ट्रैक को तोड़ता है तो खरीद संकेत उत्पन्न होता है, जब यह ट्रैक को तोड़ता है तो यह बेचने का संकेत उत्पन्न करता है। रणनीति भी ट्रेंड की दिशा का न्याय करने के लिए सुपर ट्रेंड लाइन का उपयोग करती है। जब सुपर ट्रेंड लाइन पर पार होता है, तो यह बताता है कि बैल बाजार शुरू हो गया है; जब सुपर ट्रेंड लाइन के नीचे पार होता है, तो यह बताता है कि भालू बाजार शुरू हो गया है। रणनीति संकेत उत्पन्न होने पर स्थिति खोलती है, साथ ही साथ प्रारंभिक स्टॉप-लॉस मूल्य भी सेट करती है। इसके बाद स्टॉप-लॉस मूल्य को समायोजित करने के लिए मूल्य परिवर्तन के आधार पर ट्रैक किया जाएगा, जिससे लाभ को लॉक किया जा सके और स्टॉप-लॉस को ट्रैक करने का प्रभाव प्राप्त हो सके।
श्रेष्ठता विश्लेषण
इस रणनीति में ट्रेंड दिशा निर्धारित करने के लिए सुपरट्रेंड सूचक और एटीआर सूचक के लाभों को शामिल किया गया है, जो झूठे ब्रेकआउट को प्रभावी ढंग से फ़िल्टर कर सकता है। ट्रैक किए गए स्टॉपआउट लाभ को अच्छी तरह से लॉक कर सकते हैं और पीछे हटने को कम कर सकते हैं। इसके अलावा, रणनीति विशेष रूप से रोबोट के लिए डिज़ाइन की गई है और व्यापार को स्वचालित कर सकती है।
जोखिम विश्लेषण
ओवरट्रेंड सूचक अधिक गलत संकेत उत्पन्न करने के लिए आसान है। जब स्टॉप प्राइस समायोजन की चौड़ाई अधिक होती है, तो स्टॉप को मारने की संभावना बढ़ जाती है। इसके अलावा, रोबोट ट्रेडिंग को सर्वर आउटेज, नेटवर्क आउटेज और अन्य तकनीकी जोखिमों का भी सामना करना पड़ता है।
गलत संकेत की संभावना को कम करने के लिए, एटीआर पैरामीटर को ठीक से समायोजित किया जा सकता है या अन्य संकेतकों को फ़िल्टर करने के लिए जोड़ा जा सकता है। स्टॉप लॉस ट्रैकिंग आयाम को समायोजित करने के लिए मुनाफे और जोखिम को संतुलित करने की आवश्यकता होती है। साथ ही तकनीकी विफलता के जोखिम को रोकने के लिए बैकअप सर्वर और नेटवर्क की तैयारी करें।
अनुकूलन दिशा
इस रणनीति को निम्नलिखित क्षेत्रों में अनुकूलित किया जा सकता हैः
-
गलत संकेतों से बचने के लिए प्रवेश संकेतों को फ़िल्टर करने के लिए एक सूचक या शर्त जोड़ें। उदाहरण के लिए, एक मैकड सूचक जोड़ें।
-
विभिन्न एटीआर मापदंडों के संयोजनों का परीक्षण किया जा सकता है ताकि सर्वोत्तम मापदंडों का पता लगाया जा सके।
-
स्टॉप लॉस ट्रैकिंग को अनुकूलित करने के लिए, सबसे अच्छा संतुलन बिंदु ढूंढें।
-
स्टॉप लॉस के लिए अधिक मूल्य जोड़े जा सकते हैं।
-
मुख्य सर्वर की विफलता के मामले में जल्दी से स्विच करने के लिए एक मुख्य बैकअप दोहरी सर्वर वास्तुकला स्थापित किया जा सकता है।
संक्षेप
इस रणनीति में ओवरट्रेंड सूचक और ट्रैक स्टॉप के फायदे शामिल हैं, जो स्थिति खोलने और बंद करने को स्वचालित कर सकते हैं। यह एक बहुत ही व्यावहारिक मात्रात्मक ट्रेडिंग रणनीति हो सकती है।
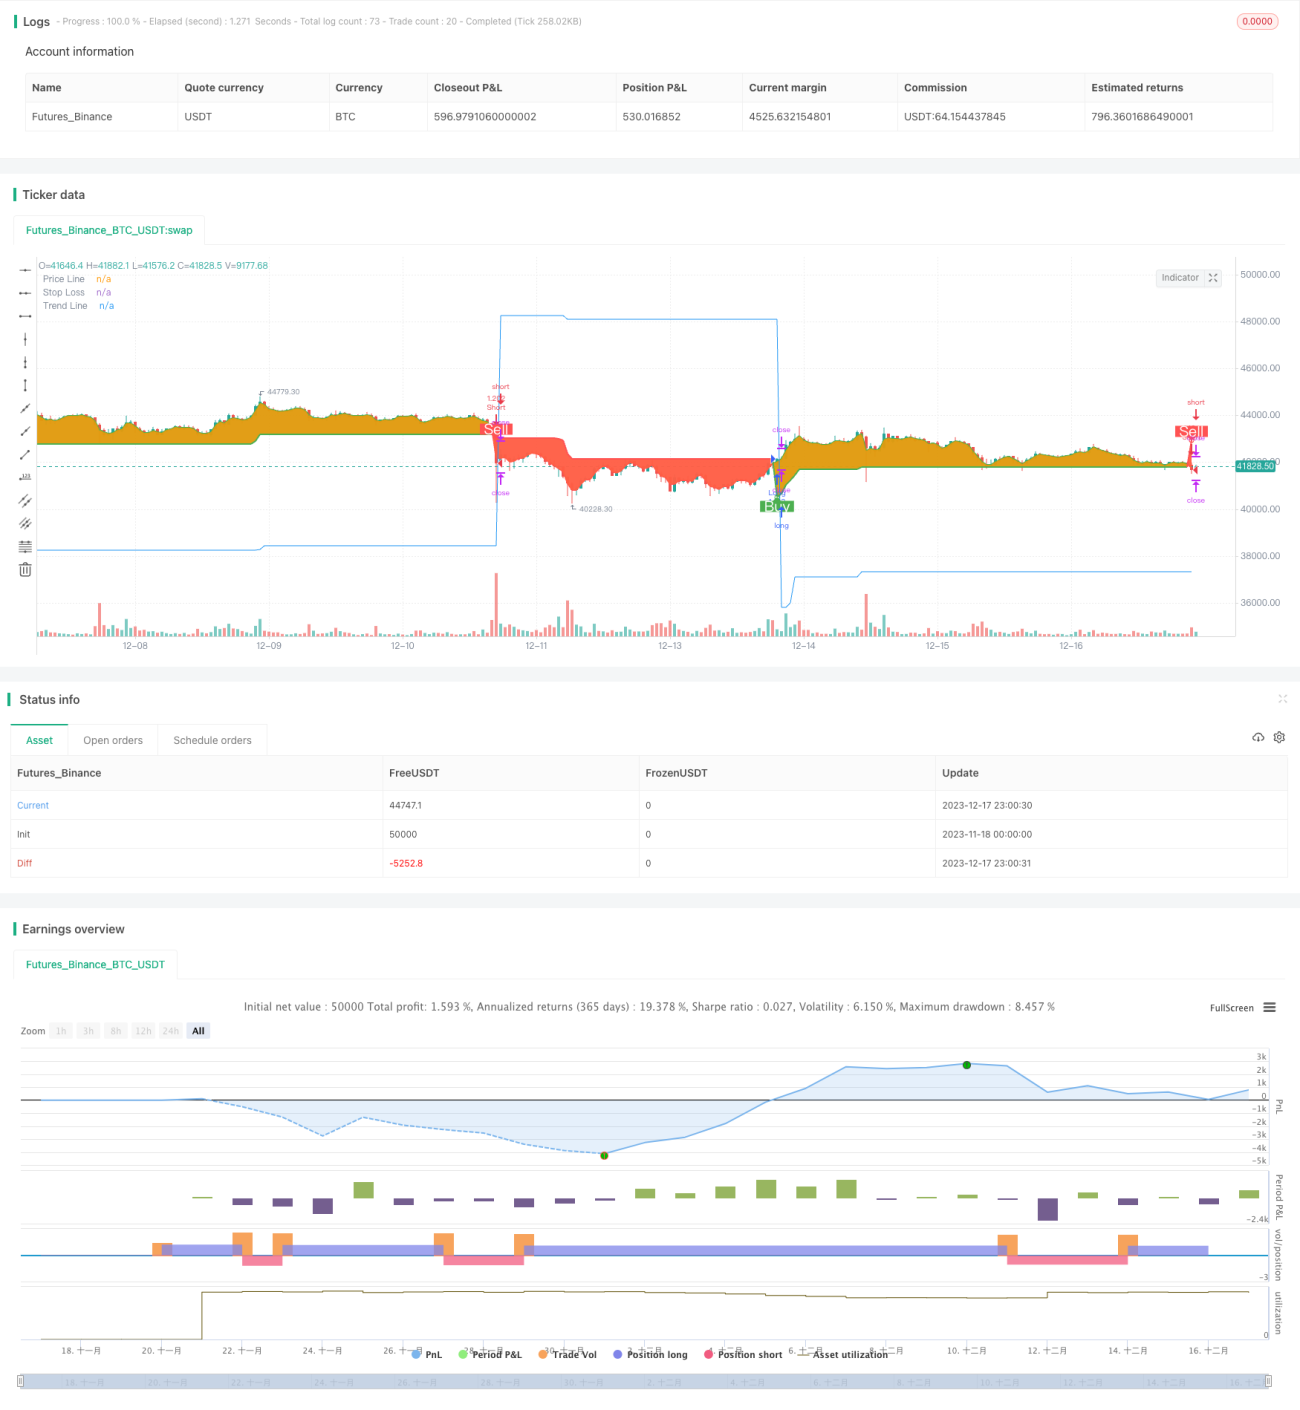
/*backtest
start: 2023-11-18 00:00:00
end: 2023-12-18 00:00:00
period: 1h
basePeriod: 15m
exchanges: [{"eid":"Futures_Binance","currency":"BTC_USDT"}]
*/

// This source code is subject to the terms of the Mozilla Public License 2.0 at https://mozilla.org/MPL/2.0/
// © arminomid1375
//@version=5
strategy('Mizar_BOT_super trend', overlay=true, default_qty_value=100, currency=currency.USD, default_qty_type=strategy.percent_of_equity, initial_capital=100, max_bars_back=4000)- 1