दोहरी सूचक संकर मात्रात्मक व्यापार रणनीति

अवलोकन
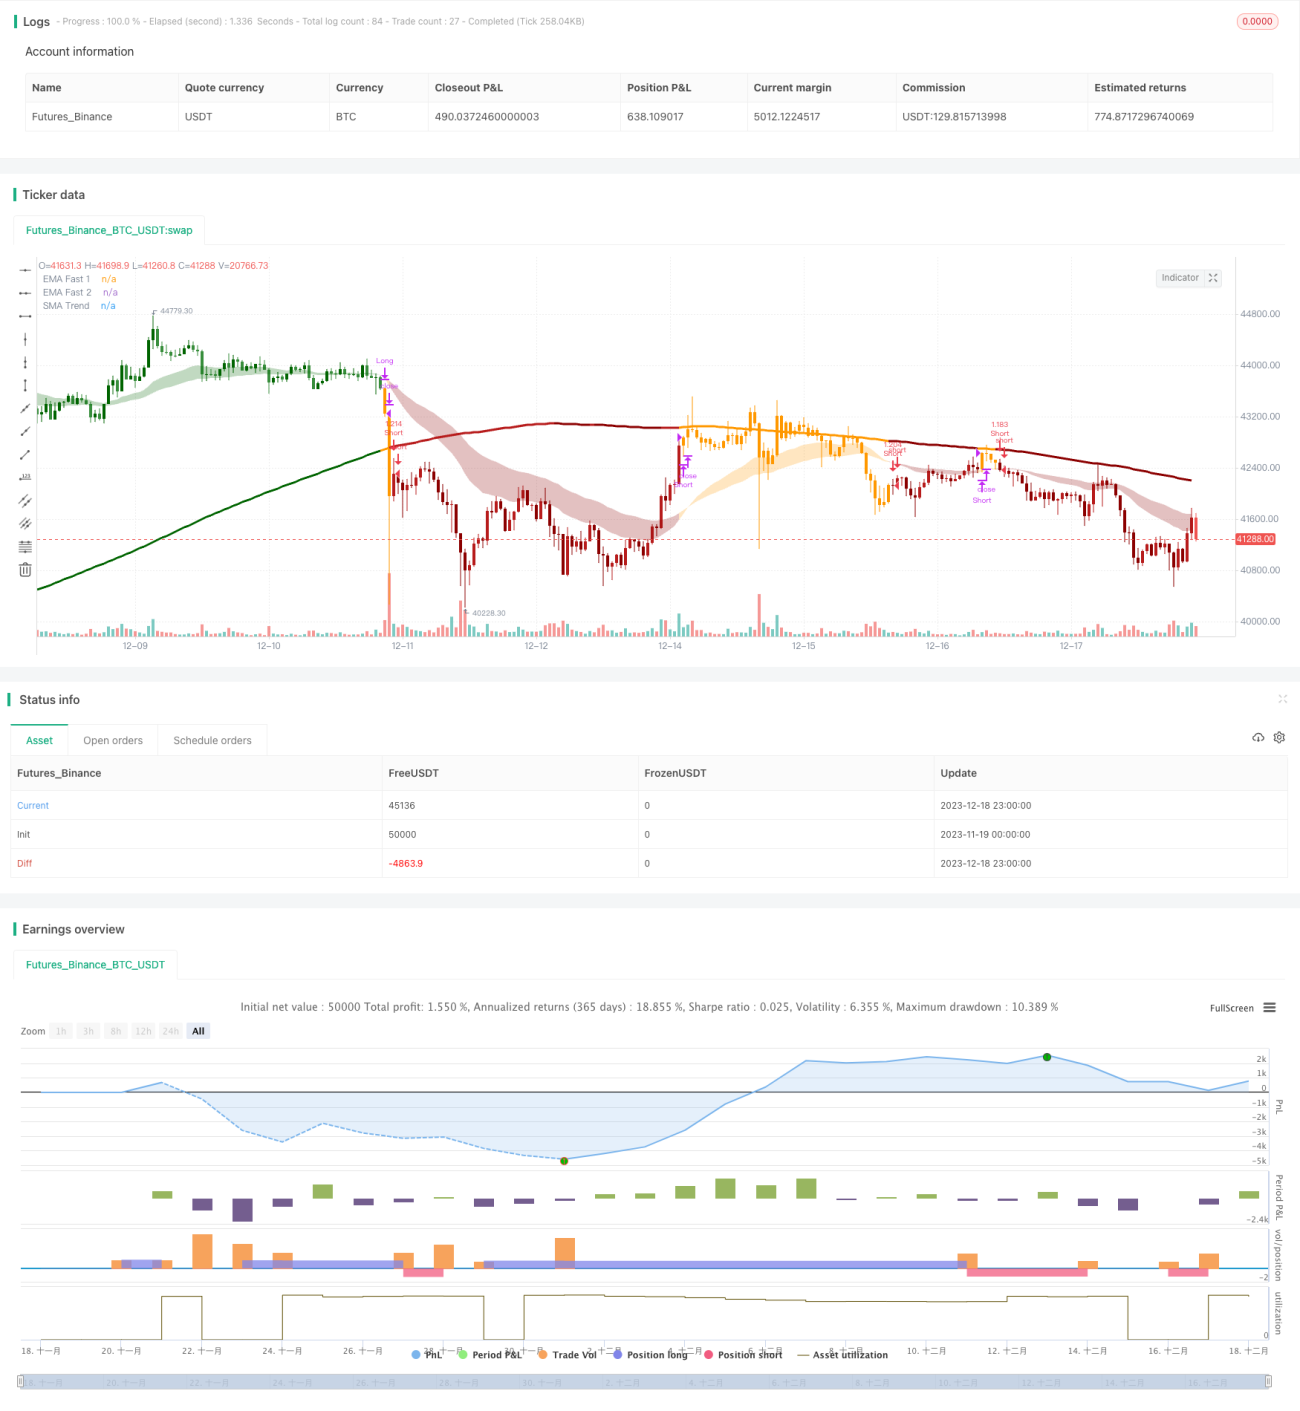
यह रणनीति दोहरे संकेतकों के संयोजन के माध्यम से प्रवृत्ति की दिशा की पहचान करती है और व्यापार करती है। सबसे पहले, यह अल्पकालिक रुझानों का न्याय करने के लिए दो चलती औसत (फास्ट लाइन और मीडियम लाइन) के क्रॉसिंग का उपयोग करता है; दूसरी बात, यह मुख्य प्रवृत्ति की दिशा का न्याय करने के लिए चैनल रेंज और लंबी अवधि की चलती औसत का उपयोग करता है। केवल जब दो निर्णयों के परिणाम एकजुट होते हैं, तो व्यापार संकेत उत्पन्न होते हैं। इस मिश्रित रणनीति में कई संकेतकों का उपयोग किया जाता है, जो झूठे संकेतों को प्रभावी रूप से फ़िल्टर करने और स्थिरता बढ़ाने में मदद करता है।
रणनीति सिद्धांत
इस रणनीति में तीन सूचकांकों के सेट का उपयोग किया जाता है। सबसे पहले, त्वरित रेखा ईएमए ((26 चक्र) और मध्यम गति रेखा ईएमए ((50 चक्र) का एक सुनहरा कांटा अल्पकालिक प्रवृत्ति का न्याय करने के लिए; दूसरा, चैनल रेंज की गणना, यह निर्धारित करने के लिए कि क्या कीमतें मध्यवर्ती प्रवृत्ति की अधिकता का न्याय करने के लिए इस सीमा को तोड़ती हैं; और अंत में, लंबी अवधि की औसत रेखा एसएमए ((200 चक्र) की गणना, मुख्य प्रवृत्ति की दिशा का न्याय करने के लिए कीमतों की तुलना के साथ। केवल तीन निर्णयों के सभी परिणामों के अनुरूप होने पर ही एक व्यापार संकेत जारी किया जाएगा।
और यह तर्क दिया गया हैः
-
त्वरित रेखा और मध्यम गति रेखा का क्रॉसिंग (गोल्डन फॉर्क्स ऊपर, डेड फॉर्क्स नीचे) अल्पकालिक प्रवृत्ति की दिशा निर्धारित करता है।
-
मध्यवर्ती रुझान की दिशा निर्धारित करने के लिए कि क्या कीमतों ने चैनल रेंज को तोड़ दिया है। चैनल रेंज एक दीर्घकालिक औसत के आधार पर एटीआर को घटाकर एक गुणांक से गुणा किया गया है। यदि कीमतें ऊपरी सीमा को तोड़ती हैं, तो यह आशावादी है; यदि यह नीचे की सीमा को तोड़ती है, तो यह आशावादी है।
-
मूल्य और दीर्घकालिक औसत आकार के बीच संबंध की तुलना करें और प्रमुख रुझानों की दिशा निर्धारित करें।
अंत में, ट्रेडिंग सिग्नल केवल तभी जारी किया जाता है जब तीनों निर्णयों के परिणाम एक समान होते हैं। यह मिश्रित निर्णय झूठे संकेतों को प्रभावी ढंग से फ़िल्टर करने और स्थिरता बढ़ाने में मदद कर सकता है।
रणनीतिक लाभ
इस तरह के दोहरे-सूचकांकों के मिश्रण की रणनीति के कुछ फायदे हैंः
-
क्योंकि ट्रेडिंग सिग्नल को कई संकेतक परिणामों के सत्यापन की आवश्यकता होती है, इसलिए एकल संकेतक के कारण गलत सिग्नल से बचा जा सकता है।
-
उच्च लचीलापन, बाजार के अनुसार सूचकांक पैरामीटर को समायोजित कर सकते हैं. तेजी से औसत रेखा और चैनल रेंज के पैरामीटर को विभिन्न बाजार स्थितियों के लिए अनुकूलित किया जा सकता है।
-
ट्रेंड ट्रेडिंग और ब्लॉक ट्रेडिंग के संयोजन में. मध्यम-लघु अवधि के संकेतक ट्रेंड को पकड़ते हैं, लंबी अवधि के संकेतक ब्लॉक को निर्धारित करते हैं, और समग्र रूप से ट्रेंड और रिवर्स रणनीति के फायदे शामिल हैं.
-
उच्च दक्षता के साथ धन का उपयोग करना। केवल जब कई सूचकांकों के परिणाम एक समान होते हैं, तो धन का प्रभावी उपयोग किया जा सकता है, अनावश्यक लेनदेन से बचा जा सकता है।
रणनीतिक जोखिम
इस रणनीति के कुछ जोखिम भी हैं:
-
पैरामीटर सेट करने का जोखिम. चलती औसत अवधि और चैनल रेंज पैरामीटर को उचित रूप से सेट करने की आवश्यकता होती है, यदि गलत तरीके से ट्रेंड को प्रभावी ढंग से पता नहीं लगाया जा सकता है या बहुत सारे गलत संकेतों का कारण बन सकता है।
-
डबल सूचकांक व्यापार अवसरों की लागत को बढ़ाता है। एकल सूचकांक रणनीति की तुलना में, कुछ व्यापार अवसरों को याद किया जा सकता है, जो सर्वोत्तम बिंदुओं पर प्रवेश और निकास में असमर्थ हैं।
-
स्टॉप-लॉस रणनीति में सावधानी की आवश्यकता होती है। इस रणनीति में ब्रेक-आउट स्टॉप-लॉस तंत्र अनावश्यक नुकसान का कारण बन सकता है और स्टॉप-लॉस अनुपात को सावधानीपूर्वक सेट करने की आवश्यकता होती है।
-
यह रणनीति अधिक उपयुक्त है जब प्रवृत्ति स्पष्ट रूप से दिखाई देती है।
रणनीति अनुकूलन दिशा
इस रणनीति को निम्नलिखित पहलुओं से अनुकूलित किया जा सकता हैः
-
विभिन्न मापदंडों के संयोजनों का परीक्षण करें और सर्वोत्तम मापदंडों को खोजें। आप अधिक ऐतिहासिक डेटा परीक्षणों के माध्यम से सबसे अच्छा मापदंडों की स्थापना पा सकते हैं।
-
अतिरिक्त समायोज्य स्टॉप लॉस तंत्र। स्टॉप लॉस को गतिशील रूप से समायोजित करने के लिए Volatility Indicator के साथ जोड़ा जा सकता है।
-
क्षमता संकेतक की सहायता से निर्णय बढ़ाएँ। महत्वपूर्ण बिंदुओं पर स्थिति का आकार निर्धारित करने में सहायता करें, धन के उपयोग की दक्षता में सुधार करें।
-
प्रवेश के तर्क को अनुकूलित करें। एक बार प्रवेश के जोखिम को कम करने के लिए, लागत औसत रणनीति पर अधिक विचार करें।
-
मशीन लर्निंग मॉडल के साथ निर्णय करना। मॉडल की मजबूती और अनुकूलता के लिए न्यूरल नेटवर्क जैसे मॉडल को शामिल करना।
संक्षेप
इस रणनीति के माध्यम से तेजी से और लंबे समय तक ट्रिपल सूचक निर्णय और दोहरी सत्यापन तंत्र, प्रभावी रूप से झूठे संकेतों को रोकने, स्थिरता में सुधार कर सकते हैं. साथ ही प्रवृत्ति व्यापार और सीमा व्यापार के फायदे, धन का उपयोग करने की दक्षता. यह कई तरीकों से सुधार किया जा सकता है जैसे कि पैरामीटर अनुकूलन, स्टॉप लॉस अनुकूलन, और मात्रात्मक ऊर्जा संकेतक संयोजन। यह एक अनुशंसित मिश्रित मात्रात्मक रणनीति है।
- 1