Strategi Mengikuti Tren Penembusan Momentum

Ringkasan
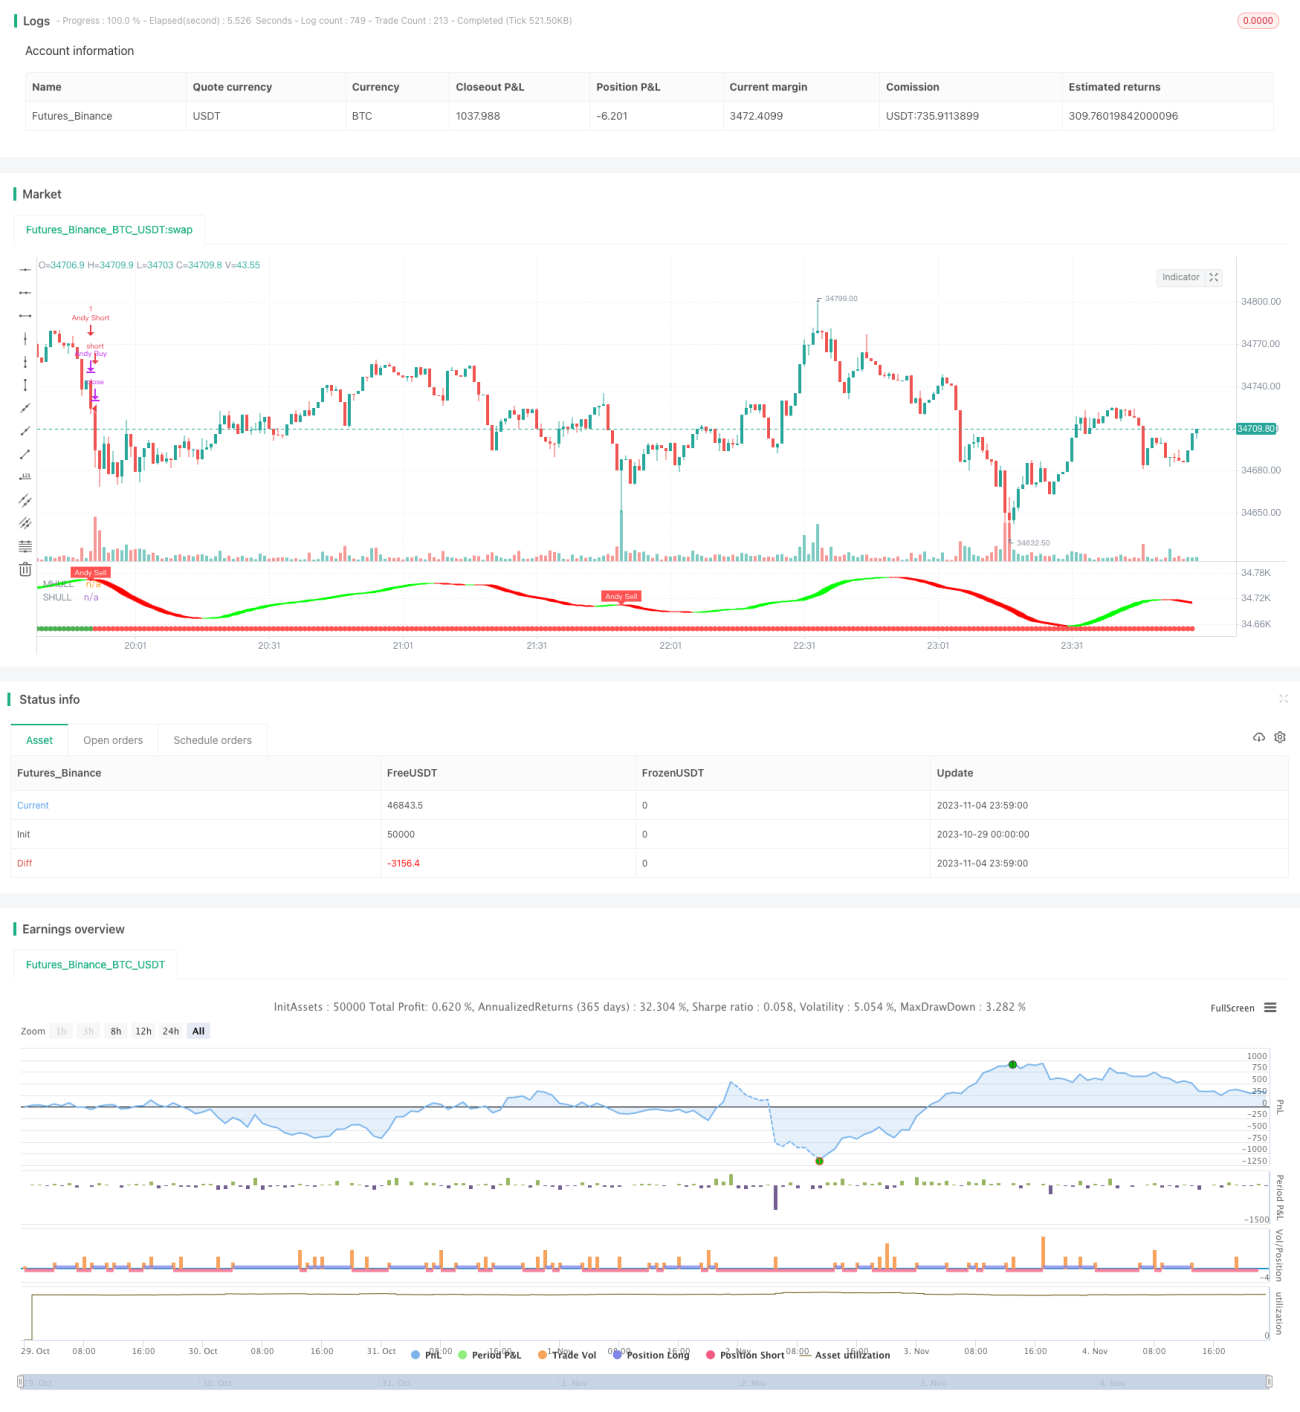
Strategi ini menggabungkan beberapa indikator teknis untuk mengidentifikasi arah tren, untuk melacak ketika tren terjadi, dan untuk mengejar keuntungan tambahan.
Prinsip Strategi
-
Menggunakan saluran Donchian untuk menilai arah tren secara keseluruhan. Ketika harga menembus saluran ini, konfirmasi adanya pergeseran tren.
-
Hull Moving Average membantu menentukan arah tren. Indikator ini sensitif terhadap perubahan harga dan dapat mendeteksi perubahan tren lebih awal.
-
Sistem semi-orbit mengirimkan sinyal beli dan jual. Sistem ini didasarkan pada saluran harga dan rentang rata-rata fluktuasi yang sebenarnya, untuk menghindari false breakout.
-
Ketika saluran Donchian, indikator Hull, dan sistem semi-orbit mengirimkan sinyal secara bersamaan, maka terjadi tren tren tren tren tren tren tren tren tren tren tren tren tren tren tren tren tren tren tren tren tren tren tren tren tren tren tren tren tren tren tren tren tren tren tren tren tren tren tren tren tren tren tren tren tren tren tren tren tren tren tren tren tren tren tren tren tren tren tren tren tren tren tren tren tren tren tren tren tren tren tren tren tren tren tren tren tren tren tren tren tren tren tren tren tren tren tren tren tren tren tren tren tren tren tren tren tren tren tren tren tren tren tren tren tren tren tren tren tren tren tren tren tren tren tren tren tren tren tren tren tren tren tren tren tren tren tren tren tren tren tren tren tren tren tren tren tren tren tren tren tren tren tren tren tren tren tren tren tren tren tren tren tren tren tren tren tren tren tren tren tren tren tren tren tren tren tren tren tren tren tren tren tren tren tren tren tren tren tren tren tren tren
-
Kondisi Posisi Padat: Ketika indikator di atas mengirimkan sinyal kebalikan, tentukan bahwa tren telah berbalik, dan segera menghentikan kerugian.
Analisis Keunggulan
-
Kombinasi multi-indikator, penilaian yang lebih baik. Saluran Donchian menilai dasar-dasar, indikator Hull dan semi-orbit menentukan detail, menangkap tren tepat di titik balik.
-
Bergerak untuk melakukan breakout, mencari keuntungan tambahan. Bermain hanya ketika tren terjadi breakout kuat, menghindari terjebak dalam getaran.
-
Stop loss yang ketat, menjamin keamanan dana. Setelah indikator mengirimkan sinyal kebalikan, stop loss segera, untuk menghindari kerugian berkembang.
-
Parameter yang disesuaikan dengan berbagai jenis pasar. Parameter seperti panjang saluran, interval fluktuasi dapat disesuaikan, dan dioptimalkan untuk siklus yang berbeda.
-
Mudah dimengerti dan diimplementasikan, bahkan bagi pemula. Kombinasi indikator dan kondisi sederhana dan mudah diprogram untuk diimplementasikan.
Analisis risiko
-
Kehilangan peluang di awal tren. Terlambat masuk, kenaikan awal tidak dapat ditangkap.
-
Penembusan yang gagal mengembalikan kerugian. Setelah masuk, mungkin terjadi penembusan yang gagal dan berbalik, menyebabkan kerugian.
-
Indikator mengirimkan sinyal yang salah. Karena parameter yang tidak tepat, penilaian indikator dapat terjadi kesalahan.
-
Terbatas jumlah transaksi. Hanya masuk saat ada terobosan tren yang jelas, dan terbatas jumlah transaksi tahunan.
Arah optimasi
-
Mengoptimalkan kombinasi parameter. Mengetes berbagai parameter untuk menemukan kombinasi terbaik.
-
Menambahkan kondisi mundur linear stop loss. Menghindari stop loss terlalu dini dan kehilangan peluang tren.
-
Menambahkan filter indikator lain. Seperti MACD, KDJ dan penilaian tambahan, mengurangi sinyal yang salah.
-
Optimalkan jangka waktu transaksi. Parameter untuk jangka waktu yang berbeda dapat dioptimalkan.
-
Meningkatkan efisiensi penggunaan dana. Meningkatkan efisiensi penggunaan dana melalui leverage, investasi tetap, dll.
Meringkaskan
Strategi ini mengintegrasikan berbagai indikator untuk menilai kapan tren terjadi momentum terobosan, dengan melacak tren yang telah terbentuk untuk mencapai keuntungan tambahan. Sistem pengendalian risiko yang ketat, pengaturan parameter yang fleksibel untuk menyesuaikan dengan lingkungan pasar yang berbeda. Meskipun frekuensi perdagangan rendah, tetapi setiap perdagangan berusaha untuk mendapatkan keuntungan yang tinggi.
- 1