Strategi mengikuti tren jangka panjang berdasarkan indikator RSI
Ringkasan
Strategi ini didasarkan pada desain indikator relatif kuat (RSI) dan mengikuti tren multi-head untuk RSI low-buy, high-stop stop loss. Strategi ini menghasilkan sinyal beli ketika RSI berada di bawah garis overbought dan menghasilkan sinyal jual ketika RSI berada di atas garis oversold. Strategi ini mengoptimalkan kinerja trend tracking dan dapat mengontrol risiko perdagangan secara efektif.
Prinsip Strategi
Strategi ini menggunakan indikator RSI untuk menentukan apakah harga saham terlalu tinggi atau terlalu rendah. Indikator RSI digabungkan dengan garis overbought dan oversold untuk membentuk sinyal beli dan jual. Secara khusus, jika indikator RSI melewati garis oversold 20 untuk menghasilkan sinyal beli; Jika indikator RSI melewati garis oversold 80 untuk menghasilkan sinyal jual.
Setelah memasuki posisi multi-head, strategi menetapkan satu stop loss awal untuk mengendalikan risiko turun. Pada saat yang sama, menetapkan dua stop loss dengan proporsi yang berbeda, dan mengelompokkan stop loss untuk mengunci keuntungan. Secara khusus, pertama-tama berhenti 50% dari posisi dengan stop loss 3% dari harga beli; kemudian berhenti 50% dari posisi yang tersisa dengan stop loss 5% dari harga beli.
Strategi ini secara ringkas dan efektif menggunakan indikator RSI untuk menentukan waktu masuk ke pasar. Pengaturan stop loss yang masuk akal dapat mengontrol risiko secara efektif.
Keunggulan Strategis
- Menggunakan RSI untuk menilai overbought, hindari overdoing secara buta
- Parameter indikator RSI dioptimalkan, indikator lebih efektif
- Desain double stop yang masuk akal, dapat mencapai batch stop dan mengunci lebih banyak keuntungan
- Penutupan awal dan penutupan berturut-turut mencegah kerugian besar
Analisis risiko
- Strategi multi-headed, tidak efektif dalam pasar banteng yang tidak dapat terus menghasilkan keuntungan
- RSI memiliki probabilitas untuk mengirimkan sinyal yang salah, dan penilaian sinyal yang salah dapat meningkatkan kerugian
- Stop loss yang terlalu dalam dapat menyebabkan risiko yang tidak dapat dihentikan
- Kurangnya batasan pada jumlah dan proporsi penambahan saham dapat memperbesar kerugian.
Arah optimasi
- Menyaring sinyal RSI dengan indikator lain untuk meningkatkan akurasi sinyal
- Menambahkan batasan pada jumlah dan proporsi penambahan
- Uji efek dari parameter RSI yang berbeda
- Mengoptimalkan Stop Loss, Mengurangi Risiko
Meringkaskan
Strategi ini menggunakan indikator RSI untuk menilai tren, pengaturan stop loss yang masuk akal. Dapat menilai tren tren secara efektif, mengendalikan risiko perdagangan, cocok untuk digunakan sebagai strategi pelacakan multihead. Dapat meningkatkan stabilitas strategi melalui filter sinyal, pengujian parameter, dan pengoptimalan stop loss.
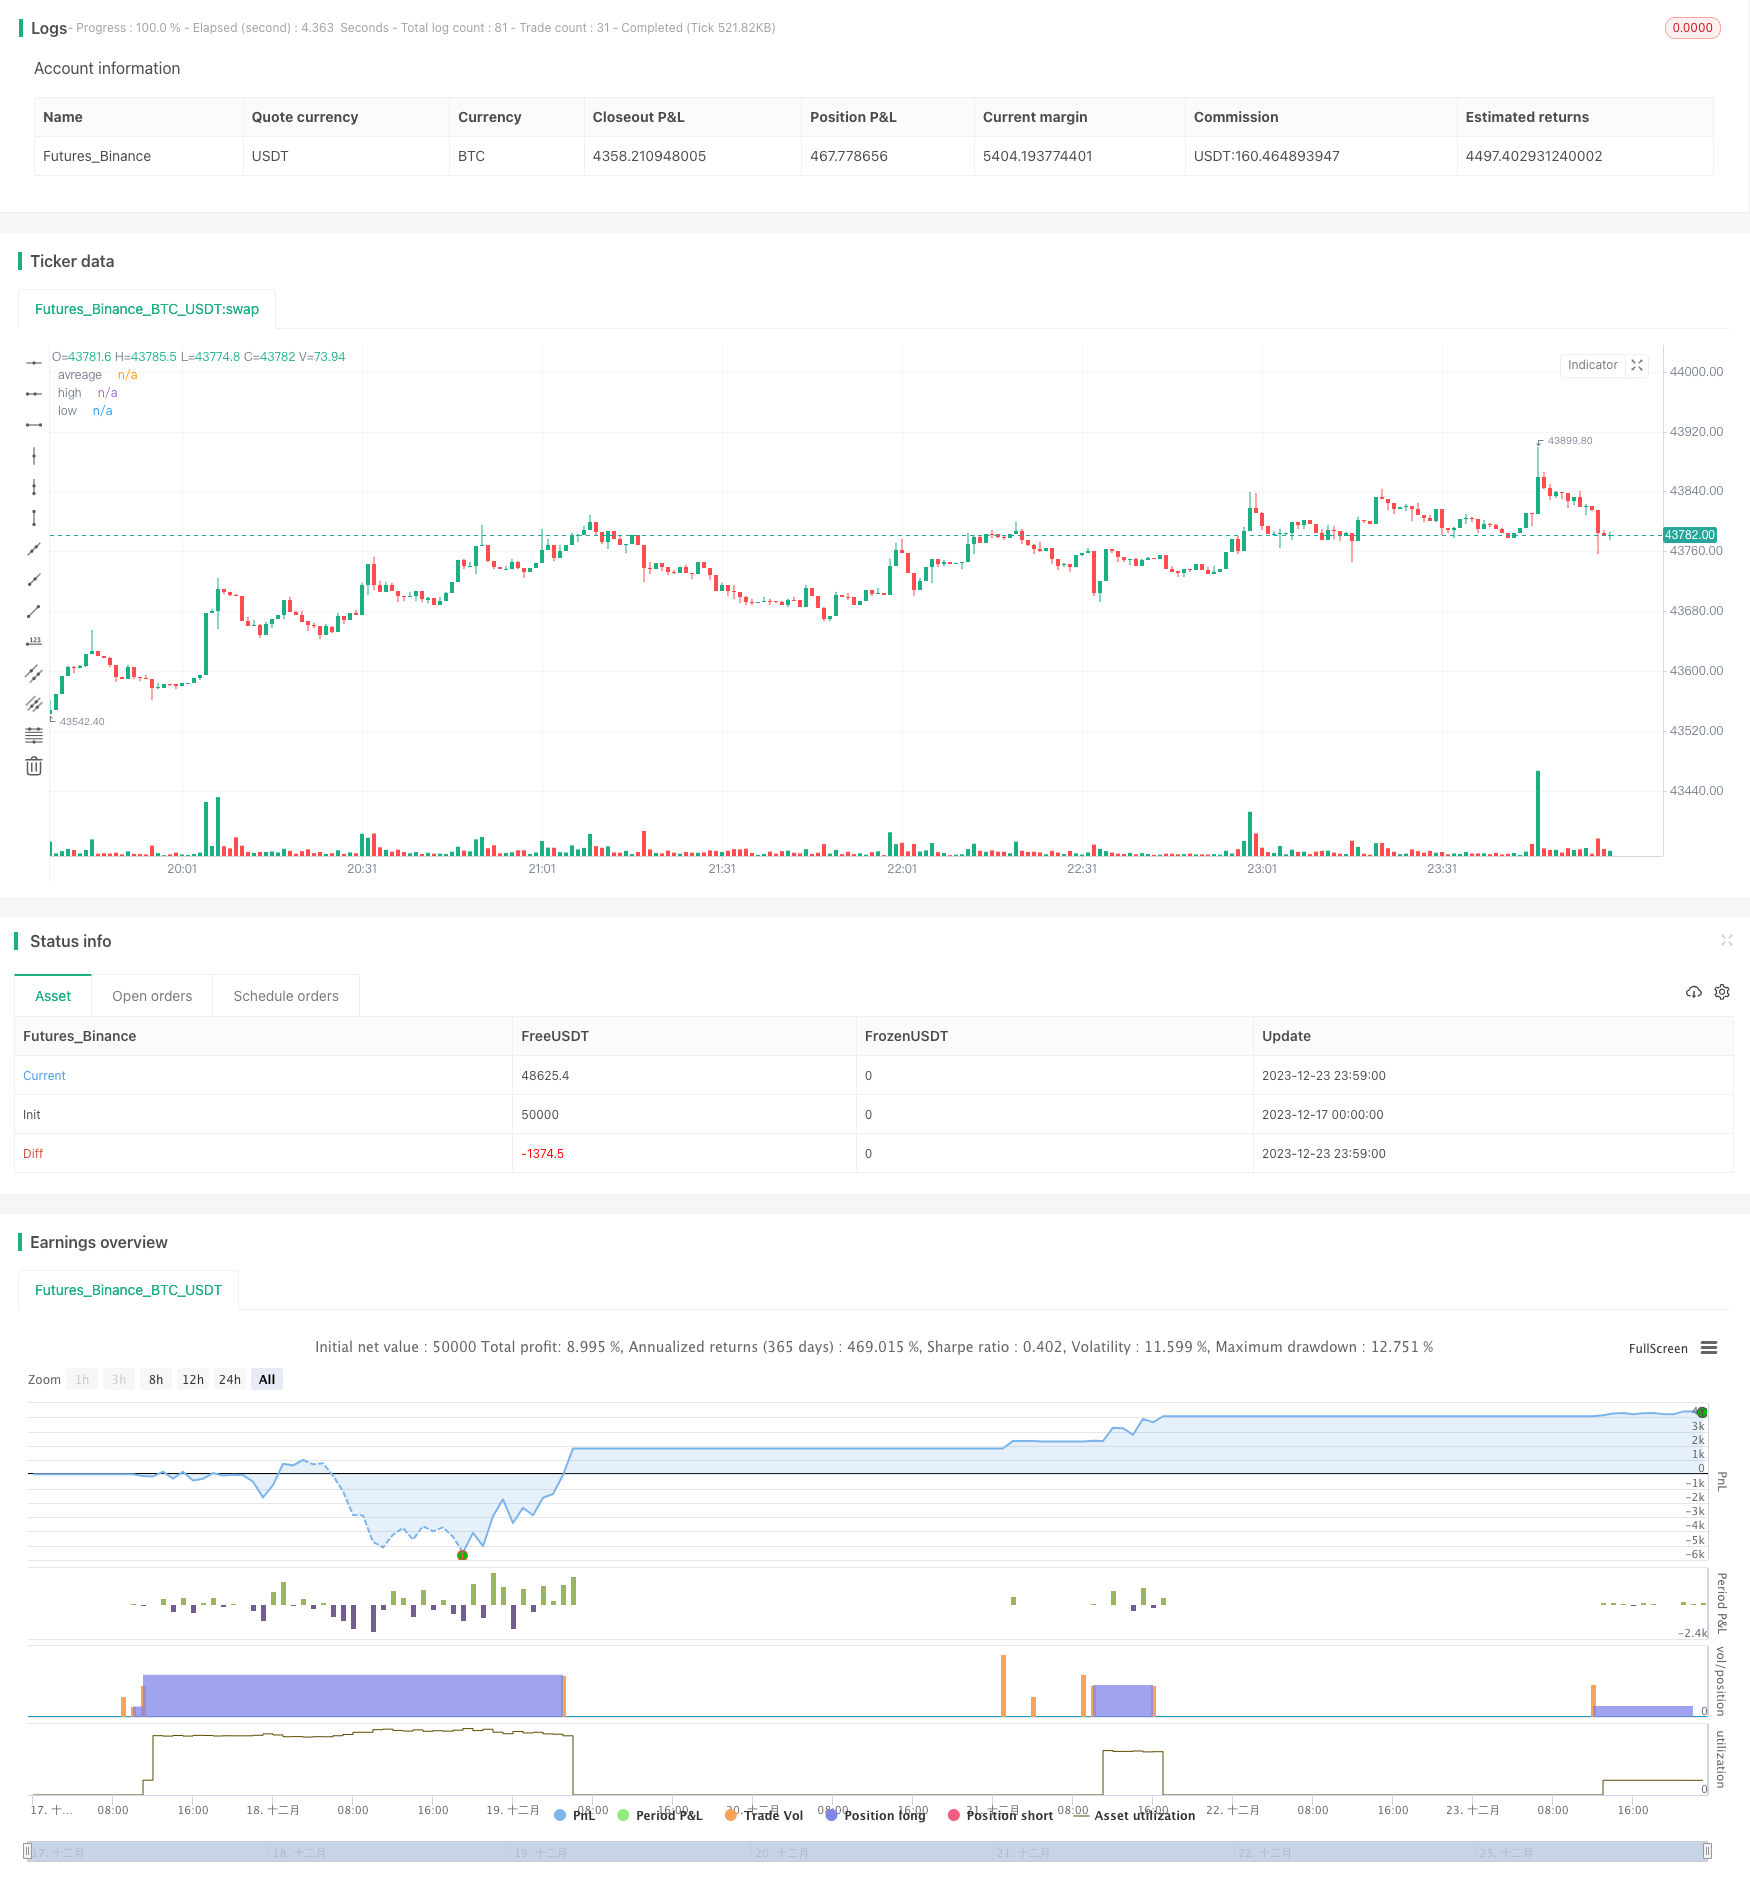
/*backtest
start: 2023-12-17 00:00:00
end: 2023-12-24 00:00:00
period: 1m
basePeriod: 1m
exchanges: [{"eid":"Futures_Binance","currency":"BTC_USDT"}]
*/

// This source code is subject to the terms of the Mozilla Public License 2.0 at https://mozilla.org/MPL/2.0/

//@version=5

strategy(title='RSI Long Strategy', overlay=true, pyramiding=5, initial_capital=10000, default_qty_type=strategy.percent_of_equity, default_qty_value=100, calc_on_order_fills=false, slippage=0, commission_type=strategy.commission.percent, commission_value=0.075)
strat_dir_input = input.string(title='Strategy Direction', defval='long', options=['long', 'short', 'all'])
strat_dir_value = strat_dir_input == 'long' ? strategy.direction.long : strat_dir_input == 'short' ? strategy.direction.short : strategy.direction.all
strategy.risk.allow_entry_in(strat_dir_value)
//INPUTS


length = input(21)
overSold = input(20)
overBought = input(80)
p = close

vrsi = ta.rsi(p, length)
price = close
var bool long = na
var bool short = na

long := ta.crossover(vrsi, overSold)
short := ta.crossunder(vrsi, overBought)

var float last_open_long = na
var float last_open_short = na

last_open_long := long ? close : nz(last_open_long[1])
last_open_short := short ? close : nz(last_open_short[1])
mpoint=(last_open_long+last_open_short)/2

entry_value = last_open_long
entry_value1 = last_open_short

// Rounding levels to min tick
nround(x) =>
    n = math.round(x / syminfo.mintick) * syminfo.mintick
    n
//
disp_panels = input(true, title='Display info panels?')
fibs_label_off = input(40, title='fibs label offset')
fibs_label_size = input.string(size.normal, options=[size.tiny, size.small, size.normal, size.large, size.huge], title='fibs label size')
r1_x = timenow + math.round(ta.change(time) * fibs_label_off)
r1_y = last_open_short
text1 = 'High : ' + str.tostring(nround(last_open_short))
s1_y = last_open_long
text3 = 'low : ' + str.tostring(nround(last_open_long))

R1_label = disp_panels ? label.new(x=r1_x, y=r1_y, text=text1, xloc=xloc.bar_time, yloc=yloc.price, color=color.orange, style=label.style_label_down, textcolor=color.black, size=fibs_label_size) : na
S1_label = disp_panels ? label.new(x=r1_x, y=s1_y, text=text3, xloc=xloc.bar_time, yloc=yloc.price, color=color.lime, style=label.style_label_up, textcolor=color.black, size=fibs_label_size) : na

label.delete(R1_label[1])
label.delete(S1_label[1])
//
plot(mpoint, title='avreage', color=color.new(color.red, 40), style=plot.style_linebr, linewidth=3, trackprice=true, offset=-9999)
plot(last_open_short, title='high', color=color.new(color.red, 40), style=plot.style_linebr, linewidth=3, trackprice=true, offset=-9999)
plot(last_open_long, title='low', color=color.new(color.blue, 40), style=plot.style_linebr, linewidth=3, trackprice=true, offset=-9999)
//
trend = input(false)
if barstate.islast and trend == true
    line z = line.new(bar_index[1], last_open_short[1], bar_index, last_open_short, extend=extend.both, color=color.red, style=line.style_dashed, width=1)
    line f = line.new(bar_index[1], mpoint[1], bar_index, mpoint, extend=extend.both, color=color.blue, style=line.style_dashed, width=1)
    line w = line.new(bar_index[1], last_open_long[1], bar_index, last_open_long, extend=extend.both, color=color.green, style=line.style_dashed, width=1)
    line.delete(z[1])
    line.delete(f[1])
    line.delete(w[1])

//bu = ta.crossover(close, mpoint)
//sz = ta.crossunder(close, mpoint)
//bu1 = ta.crossover(close, last_open_short)
sz1 = ta.crossunder(close, last_open_short)
bu2 = ta.crossover(close, last_open_long)
//sz2 = ta.crossunder(close, last_open_long)
//plotshape(sz, style=shape.triangledown, location=location.abovebar, color=color.new(color.orange, 0), size=size.tiny)
//plotshape(bu, style=shape.triangleup, location=location.belowbar, color=color.new(color.blue, 0), size=size.tiny)
//plotshape(sz1, style=shape.triangledown, location=location.abovebar, color=color.new(color.red, 0), size=size.tiny)
//plotshape(bu1, style=shape.triangleup, location=location.belowbar, color=color.new(color.green, 0), size=size.tiny)
//plotshape(sz2, style=shape.triangledown, location=location.abovebar, color=color.new(color.red, 0), size=size.tiny)
//plotshape(bu2, style=shape.triangleup, location=location.belowbar, color=color.new(color.green, 0), size=size.tiny)

l = bu2
s = sz1
if l
    strategy.entry('buy', strategy.long)
if s
    strategy.entry('sell', strategy.short)
per(pcnt) =>
    strategy.position_size != 0 ? math.round(pcnt / 100 * strategy.position_avg_price / syminfo.mintick) : float(na)
stoploss = input.float(title=' stop loss', defval=5, minval=0.01)
los = per(stoploss)
q1 = input.int(title=' qty_percent1', defval=50, minval=1)
q2 = input.int(title=' qty_percent2', defval=50, minval=1)
tp1 = input.float(title=' Take profit1', defval=3, minval=0.01)
tp2 = input.float(title=' Take profit2', defval=5, minval=0.01)
//tp4 = input.float(title=' Take profit4', defval=5, minval=0.01)
strategy.exit('x1', qty_percent=q1, profit=per(tp1), loss=los)
strategy.exit('x2', qty_percent=q2, profit=per(tp2), loss=los)