Strategi beli tinggi dan jual rendah berdasarkan garis bagian emas pivot
Ringkasan
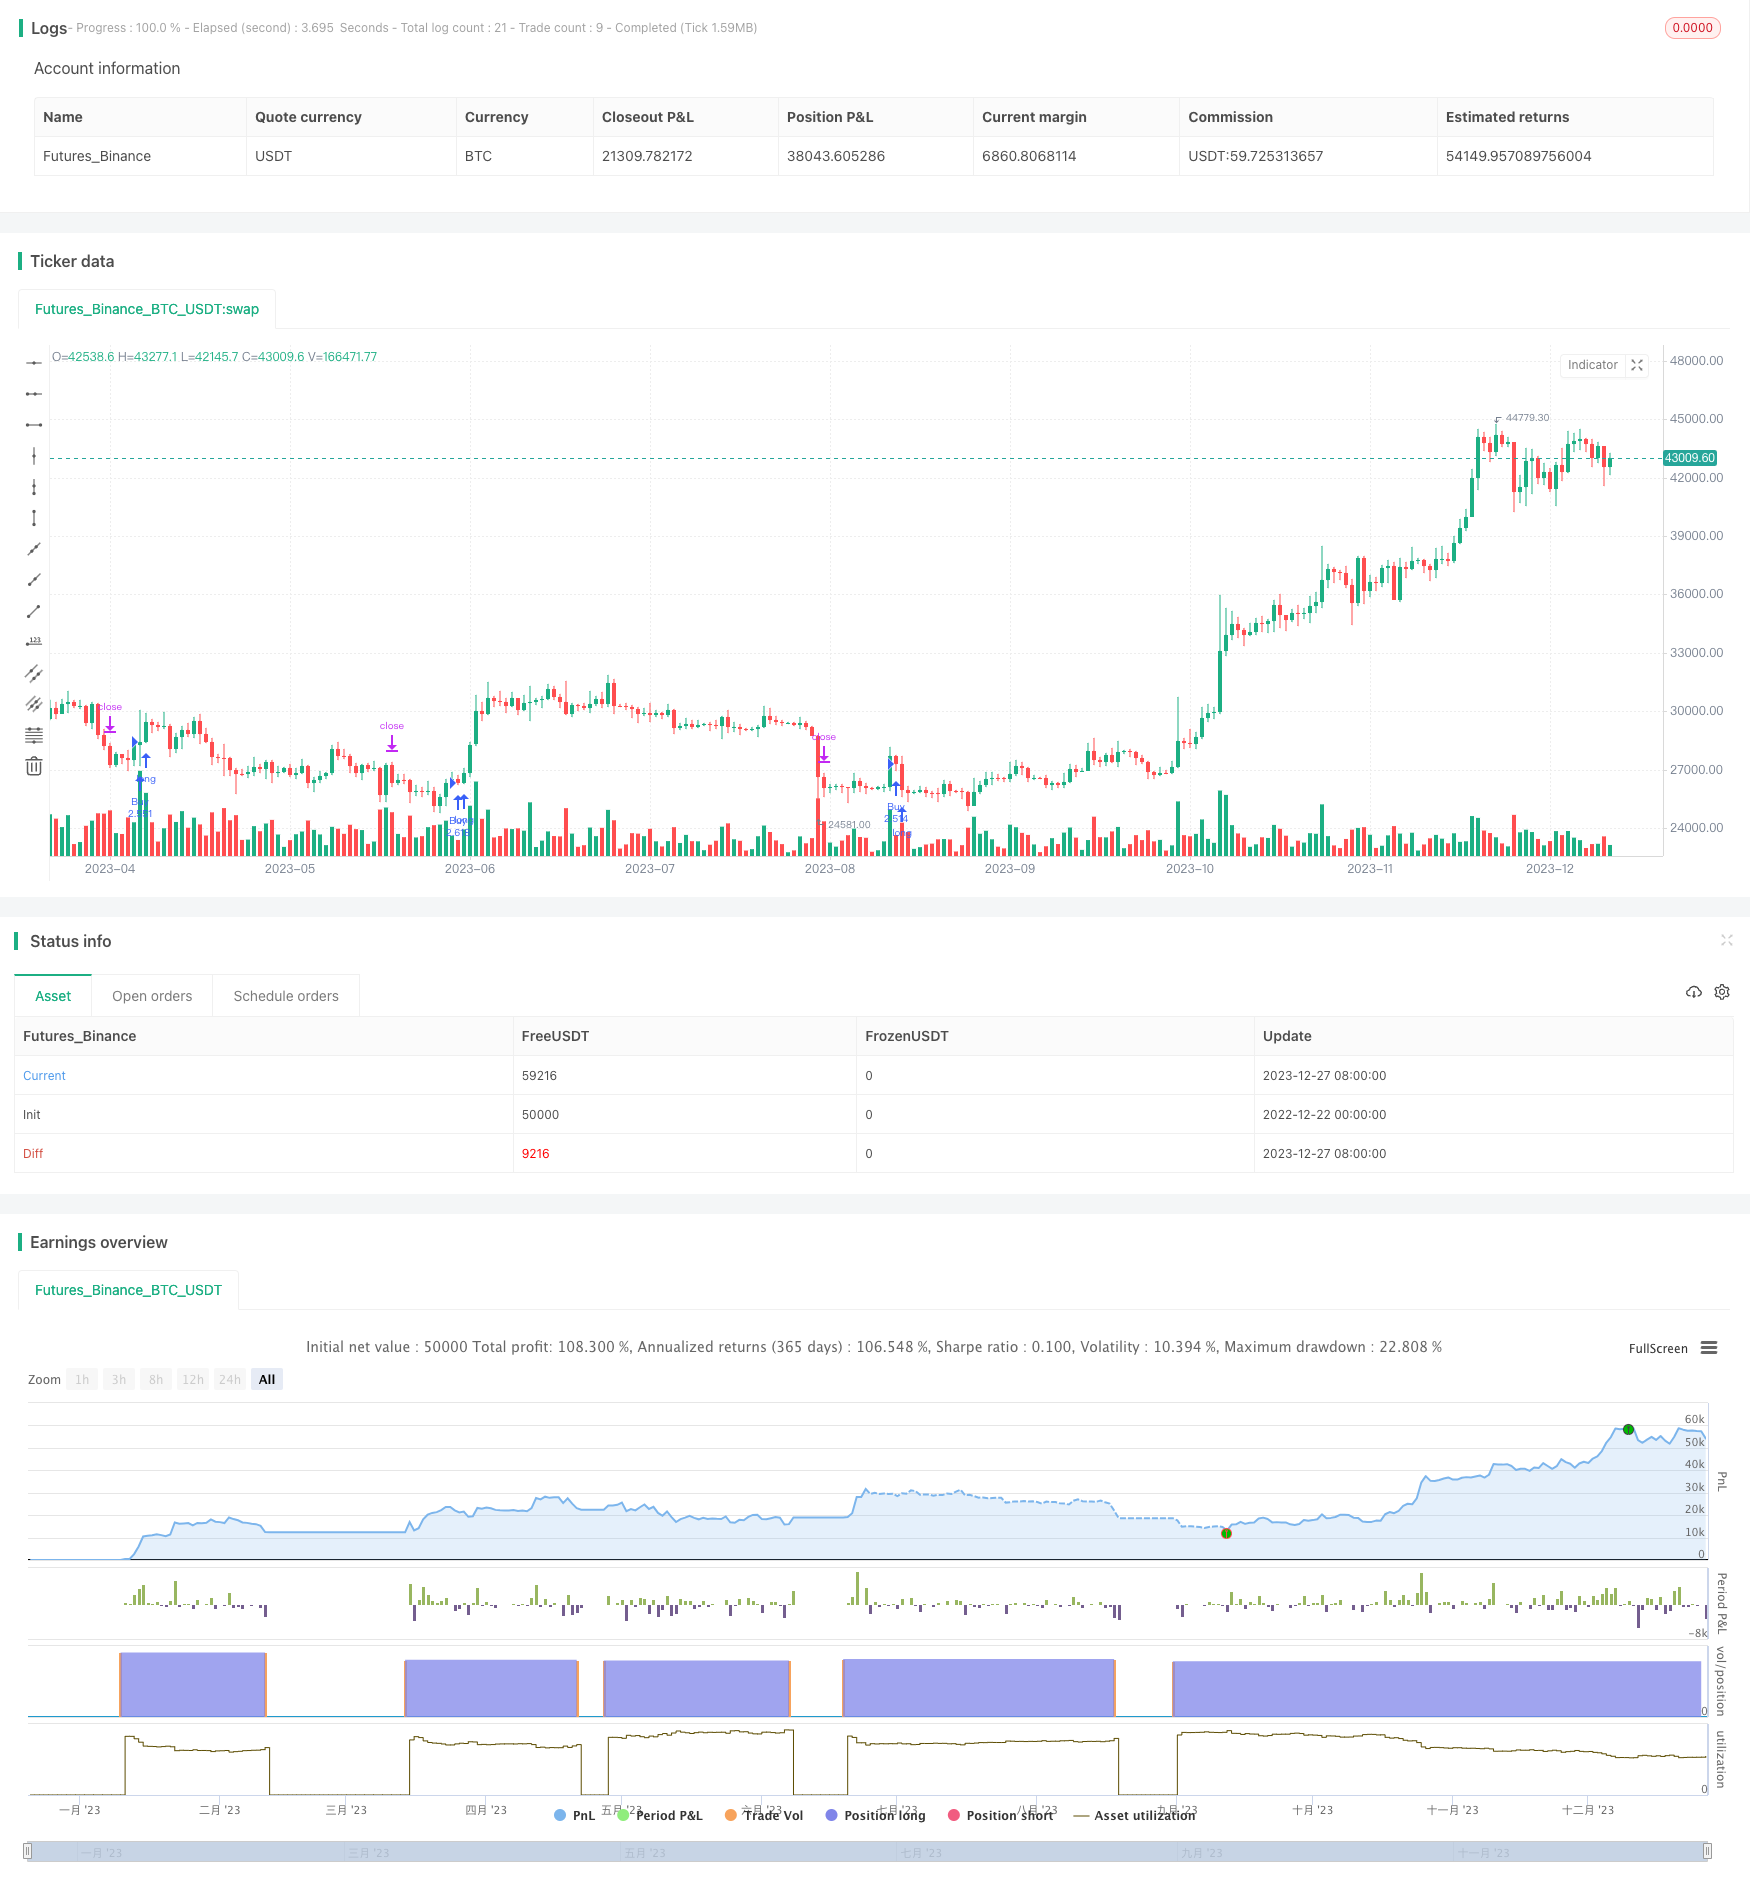
Strategi ini menghasilkan strategi perdagangan yang lebih tinggi dan lebih rendah dengan menghitung titik pivot dari periode waktu yang berbeda sebagai area harga kunci, dan dengan prinsip garis pemisah emas untuk menentukan arah tren.
Prinsip Strategi
Perhitungan harga penutupan, harga tertinggi, dan harga terendah dari berbagai periode waktu.
Berdasarkan harga terobosan naik turun, menilai daerah harga saat ini berada. Dibagi menjadi 5 daerah beli dan 5 daerah jual.
Sinyal beli di area beli, sinyal jual di area jual, dan strategi jual beli tinggi.
Analisis Keunggulan
Menggunakan beberapa periode waktu untuk menilai tren dan menghindari kebisingan pasar.
Hal ini dikombinasikan dengan pegangan klasik dan pegangan pemisahan emas untuk meningkatkan keandalan pegangan.
Untuk menghindari risiko kerugian, pilihlah zona harga untuk menentukan waktu masuk ke pasar.
Menggunakan strategi jual beli tinggi, sesuai dengan aturan perdagangan tren, menghindari perdagangan berlawanan arah.
Analisis risiko
Titik-titik ini mungkin tidak berfungsi dan perlu diperhatikan jika ada yang menerobos titik-titik tersebut.
Hal ini dilakukan untuk mencegah terjadinya kerugian yang lebih besar.
Biaya transaksi juga mempengaruhi pendapatan akhir.
Arah optimasi
Anda dapat menguji parameter yang berbeda, seperti parameter siklus waktu, parameter arah perdagangan, dan lain-lain, untuk mengoptimalkan strategi.
Indikator ini dapat dikombinasikan dengan indikator lain untuk mengidentifikasi tren dan menghindari false breakout.
Anda dapat menambahkan mekanisme stop loss untuk mengendalikan kerugian tunggal.
Meringkaskan
Strategi ini mengintegrasikan metode analisis teknis klasik dengan strategi perdagangan tren, menggunakan area pivot untuk menentukan waktu masuk ke pasar, dan mengadopsi prinsip jual beli tinggi, yang dapat secara efektif mengendalikan risiko perdagangan, yang layak untuk diverifikasi dan dioptimalkan.
/*backtest
start: 2022-12-22 00:00:00
end: 2023-12-28 00:00:00
period: 1d
basePeriod: 1h
exchanges: [{"eid":"Futures_Binance","currency":"BTC_USDT"}]
*/

// This source code is subject to the terms of the Mozilla Public License 2.0 at https://mozilla.org/MPL/2.0/
// © HeWhoMustNotBeNamed

//@version=4
strategy("BuyHighSellLow - Pivot points", overlay=true, initial_capital = 100000, default_qty_type = strategy.percent_of_equity, default_qty_value = 100, commission_type = strategy.commission.percent, pyramiding = 1, commission_value = 0.01, calc_on_order_fills = true)
Source = input(close)
resolution = input("4D", type=input.resolution)
HTFMultiplier = input(4, title="Higher Timeframe multiplier (Used when resolution is set to Same as Symbol)", minval=2, step=1)
//ppType = input(title="Pivot points type", defval="classic", options=["classic", "fib"])
ppType = "fib"
tradeDirection = input(title="Trade Direction", defval=strategy.direction.long, options=[strategy.direction.all, strategy.direction.long, strategy.direction.short])
backtestBars = input(title="Backtest from ", defval=10, minval=1, maxval=30)
backtestFrom = input(title="Timeframe", defval="years", options=["days", "months", "years"])
hideBands = input(true)
f_multiple_resolution(HTFMultiplier) =>
    target_Res_In_Min = timeframe.multiplier * HTFMultiplier * (
      timeframe.isseconds   ? 1. / 60. :
      timeframe.isminutes   ? 1. :
      timeframe.isdaily     ? 1440. :
      timeframe.isweekly    ? 7. * 24. * 60. :
      timeframe.ismonthly   ? 30.417 * 24. * 60. : na)

    target_Res_In_Min     <= 0.0417       ? "1S"  :
      target_Res_In_Min   <= 0.167        ? "5S"  :
      target_Res_In_Min   <= 0.376        ? "15S" :
      target_Res_In_Min   <= 0.751        ? "30S" :
      target_Res_In_Min   <= 1440         ? tostring(round(target_Res_In_Min)) :
      tostring(round(min(target_Res_In_Min / 1440, 365))) + "D"

f_getBackTestTimeFrom(backtestFrom, backtestBars)=>
    byDate = backtestFrom == "days"
    byMonth = backtestFrom == "months"
    byYear = backtestFrom == "years"

    date = dayofmonth(timenow)
    mth = month(timenow)
    yr = year(timenow)

    leapYearDaysInMonth = array.new_int(12,0)
    array.set(leapYearDaysInMonth,0,31)
    array.set(leapYearDaysInMonth,1,29)
    nonleapYearDaysInMonth = array.new_int(12,0)
    array.set(leapYearDaysInMonth,0,31)
    array.set(leapYearDaysInMonth,1,28)

    restMonths = array.new_int(10,0)
    array.set(leapYearDaysInMonth,0,31)
    array.set(leapYearDaysInMonth,1,30)
    array.set(leapYearDaysInMonth,2,31)
    array.set(leapYearDaysInMonth,3,30)
    array.set(leapYearDaysInMonth,4,31)
    array.set(leapYearDaysInMonth,5,31)
    array.set(leapYearDaysInMonth,6,30)
    array.set(leapYearDaysInMonth,7,31)
    array.set(leapYearDaysInMonth,8,30)
    array.set(leapYearDaysInMonth,9,31)

    array.concat(leapYearDaysInMonth,restMonths)
    array.concat(nonleapYearDaysInMonth,restMonths)
    isLeapYear = yr % 4 == 0 and (year%100 != 0 or year%400 == 0)
    numberOfDaysInCurrentMonth = isLeapYear ? array.get(leapYearDaysInMonth, mth-2) : array.get(nonleapYearDaysInMonth, mth-2)
    if(byDate)
        mth := (date - backtestBars) < 0 ? mth - 1 : mth
        yr := mth < 1 ? yr - 1 : yr
        mth := mth < 1 ? 1 : mth
        date := (date - backtestBars) < 0 ? numberOfDaysInCurrentMonth - backtestBars + date + 1 : date - backtestBars + 1
    if(byMonth)
        date := 1
        yr := (mth - (backtestBars%12)) < 0 ? yr - int(backtestBars/12) - 1 : yr - int(backtestBars/12)
        mth := mth - (backtestBars%12) + 1
    if(byYear)
        date := 1
        mth := 1
        yr := yr - backtestBars
    [date, mth, yr]

f_secureSecurity(_symbol, _res, _src) => security(_symbol, _res, _src[1], lookahead = barmerge.lookahead_on)

f_getClassicPivots(HIGHprev, LOWprev, CLOSEprev)=>
    PP = (HIGHprev + LOWprev + CLOSEprev) / 3
    R1 = PP * 2 - LOWprev
    S1 = PP * 2 - HIGHprev
    R2 = PP + (HIGHprev - LOWprev)
    S2 = PP - (HIGHprev - LOWprev)
    R3 = PP * 2 + (HIGHprev - 2 * LOWprev)
    S3 = PP * 2 - (2 * HIGHprev - LOWprev)
    R4 = PP * 3 + (HIGHprev - 3 * LOWprev)
    S4 = PP * 3 - (3 * HIGHprev - LOWprev)
    R5 = PP * 4 + (HIGHprev - 4 * LOWprev)
    S5 = PP * 4 - (4 * HIGHprev - LOWprev)
    [R5, R4, R3, R2, R1, PP, S1, S2, S3, S4, S5]

f_getFibPivots(HIGHprev, LOWprev, CLOSEprev)=>
    PP = (HIGHprev + LOWprev + CLOSEprev) / 3
    R1 = PP + 0.382 * (HIGHprev - LOWprev)
    S1 = PP - 0.382 * (HIGHprev - LOWprev)
    R2 = PP + 0.618 * (HIGHprev - LOWprev)
    S2 = PP - 0.618 * (HIGHprev - LOWprev)
    R3 = PP + (HIGHprev - LOWprev)
    S3 = PP - (HIGHprev - LOWprev)
    R4 = PP + 1.41 * (HIGHprev - LOWprev)
    S4 = PP - 1.41 * (HIGHprev - LOWprev)
    R5 = PP + 1.65 * (HIGHprev - LOWprev)
    S5 = PP - 1.65 * (HIGHprev - LOWprev)
    [R5, R4, R3, R2, R1, PP, S1, S2, S3, S4, S5]

f_getPivotPoints(HTFMultiplier, resolution, ppType)=>
    derivedResolution = resolution == ""? f_multiple_resolution(HTFMultiplier) : resolution
    HIGHprev = f_secureSecurity(syminfo.tickerid, derivedResolution, high)
    LOWprev = f_secureSecurity(syminfo.tickerid, derivedResolution, low)
    CLOSEprev = f_secureSecurity(syminfo.tickerid, derivedResolution, close)
    [R5, R4, R3, R2, R1, PP, S1, S2, S3, S4, S5] = f_getClassicPivots(HIGHprev, LOWprev, CLOSEprev)
    [Rf5, Rf4, Rf3, Rf2, Rf1, PPf, Sf1, Sf2, Sf3, Sf4, Sf5] = f_getFibPivots(HIGHprev, LOWprev, CLOSEprev)
    [R5, R4, R3, R2, R1, PP, S1, S2, S3, S4, S5]

f_getState(Source, R5, R4, R3, R2, R1, PP, S1, S2, S3, S4, S5)=>
    state =
     Source > R5 ? 5 :
     Source > R4 ? 4 :
     Source > R3 ? 3 :
     Source > R2 ? 2 :
     Source > R1 ? 1 :
     Source > PP ? 0 :
     Source > S1 ? -1 :
     Source > S2 ? -2 :
     Source > S3 ? -3 :
     Source > S4 ? -4 :
     Source > S5 ? -5 : -6
    state

[R5, R4, R3, R2, R1, PP, S1, S2, S3, S4, S5] = f_getPivotPoints(HTFMultiplier, resolution, ppType)

[date, mth, yr] = f_getBackTestTimeFrom(backtestFrom, backtestBars)
inDateRange = time >= timestamp(syminfo.timezone, yr, mth, date, 0, 0)

BBU5 = plot(not hideBands ? R5: na, title="R5", color=color.orange, linewidth=1, transp=50, style=plot.style_linebr)
BBU4 = plot(not hideBands ? R4: na, title="R4", color=color.yellow, linewidth=1, transp=50, style=plot.style_linebr)
BBU3 = plot(not hideBands ? R3: na, title="R3", color=color.navy, linewidth=1, transp=50, style=plot.style_linebr)
BBU2 = plot(not hideBands ? R2: na, title="R2", color=color.olive, linewidth=1, transp=50, style=plot.style_linebr)
BBU1 = plot(not hideBands ? R1: na, title="R1", color=color.lime, linewidth=1, transp=50, style=plot.style_linebr)
BBM4 = plot(not hideBands ? PP:na, title="PP", color=color.black, linewidth=2, style=plot.style_linebr)
BBL1 = plot(not hideBands ? S1: na, title="S1", color=color.lime, linewidth=1, transp=50, style=plot.style_linebr)
BBL2 = plot(not hideBands ? S2: na, title="S2", color=color.olive, linewidth=1, transp=50, style=plot.style_linebr)
BBL3 = plot(not hideBands ? S3: na, title="S3", color=color.navy, linewidth=1, transp=50, style=plot.style_linebr)
BBL4 = plot(not hideBands ? S4: na, title="S4", color=color.yellow, linewidth=1, transp=50, style=plot.style_linebr)
BBL5 = plot(not hideBands ? S5: na, title="S5", color=color.orange, linewidth=1, transp=50, style=plot.style_linebr)


fill(BBU5, BBU4, title="RZ5", color=color.green, transp=90)
fill(BBU4, BBU3, title="RZ4", color=color.lime, transp=90)
fill(BBU3, BBU2, title="RZ3", color=color.olive, transp=90)
fill(BBU2, BBU1, title="RZ2", color=color.navy, transp=90)
fill(BBU1, BBM4, title="RZ1", color=color.yellow, transp=90)
fill(BBM4, BBL1, title="SZ1", color=color.orange, transp=90)
fill(BBL1, BBL2, title="SZ2", color=color.red, transp=90)
fill(BBL2, BBL3, title="SZ3", color=color.maroon, transp=90)
fill(BBL3, BBL4, title="SZ4", color=color.maroon, transp=90)
fill(BBL4, BBL5, title="SZ5", color=color.maroon, transp=90)

strategy.risk.allow_entry_in(tradeDirection)
longCondition = crossover(Source[1],R1) and inDateRange
shortCondition = crossunder(Source[1], S2) and inDateRange

strategy.entry("Buy", strategy.long, when=longCondition, oca_name="oca")
strategy.entry("Sell", strategy.short, when=shortCondition, oca_name="oca")