Strategi Penyeberangan Saluran Mobile Vegas
Gagasan inti dari strategi ini adalah untuk menilai arah tren jangka pendek dan jangka panjang dari saham berdasarkan garis rata-rata dari berbagai periode seperti EMA 36,143,169, digabungkan dengan indikator MACD untuk mengirim sinyal jual beli. Secara khusus, penilaian jangka pendek dengan EMA 5,10 hari, penilaian jangka menengah dengan EMA 20,60 hari, penilaian jangka panjang dengan EMA 120 dan 250 hari, melihat lebih tinggi dan lebih rendah saat melewati EMA jangka menengah pada EMA jangka pendek, melihat lebih rendah; digabungkan dengan indikator MACD yang lebih kosong untuk menilai peluang jual beli.
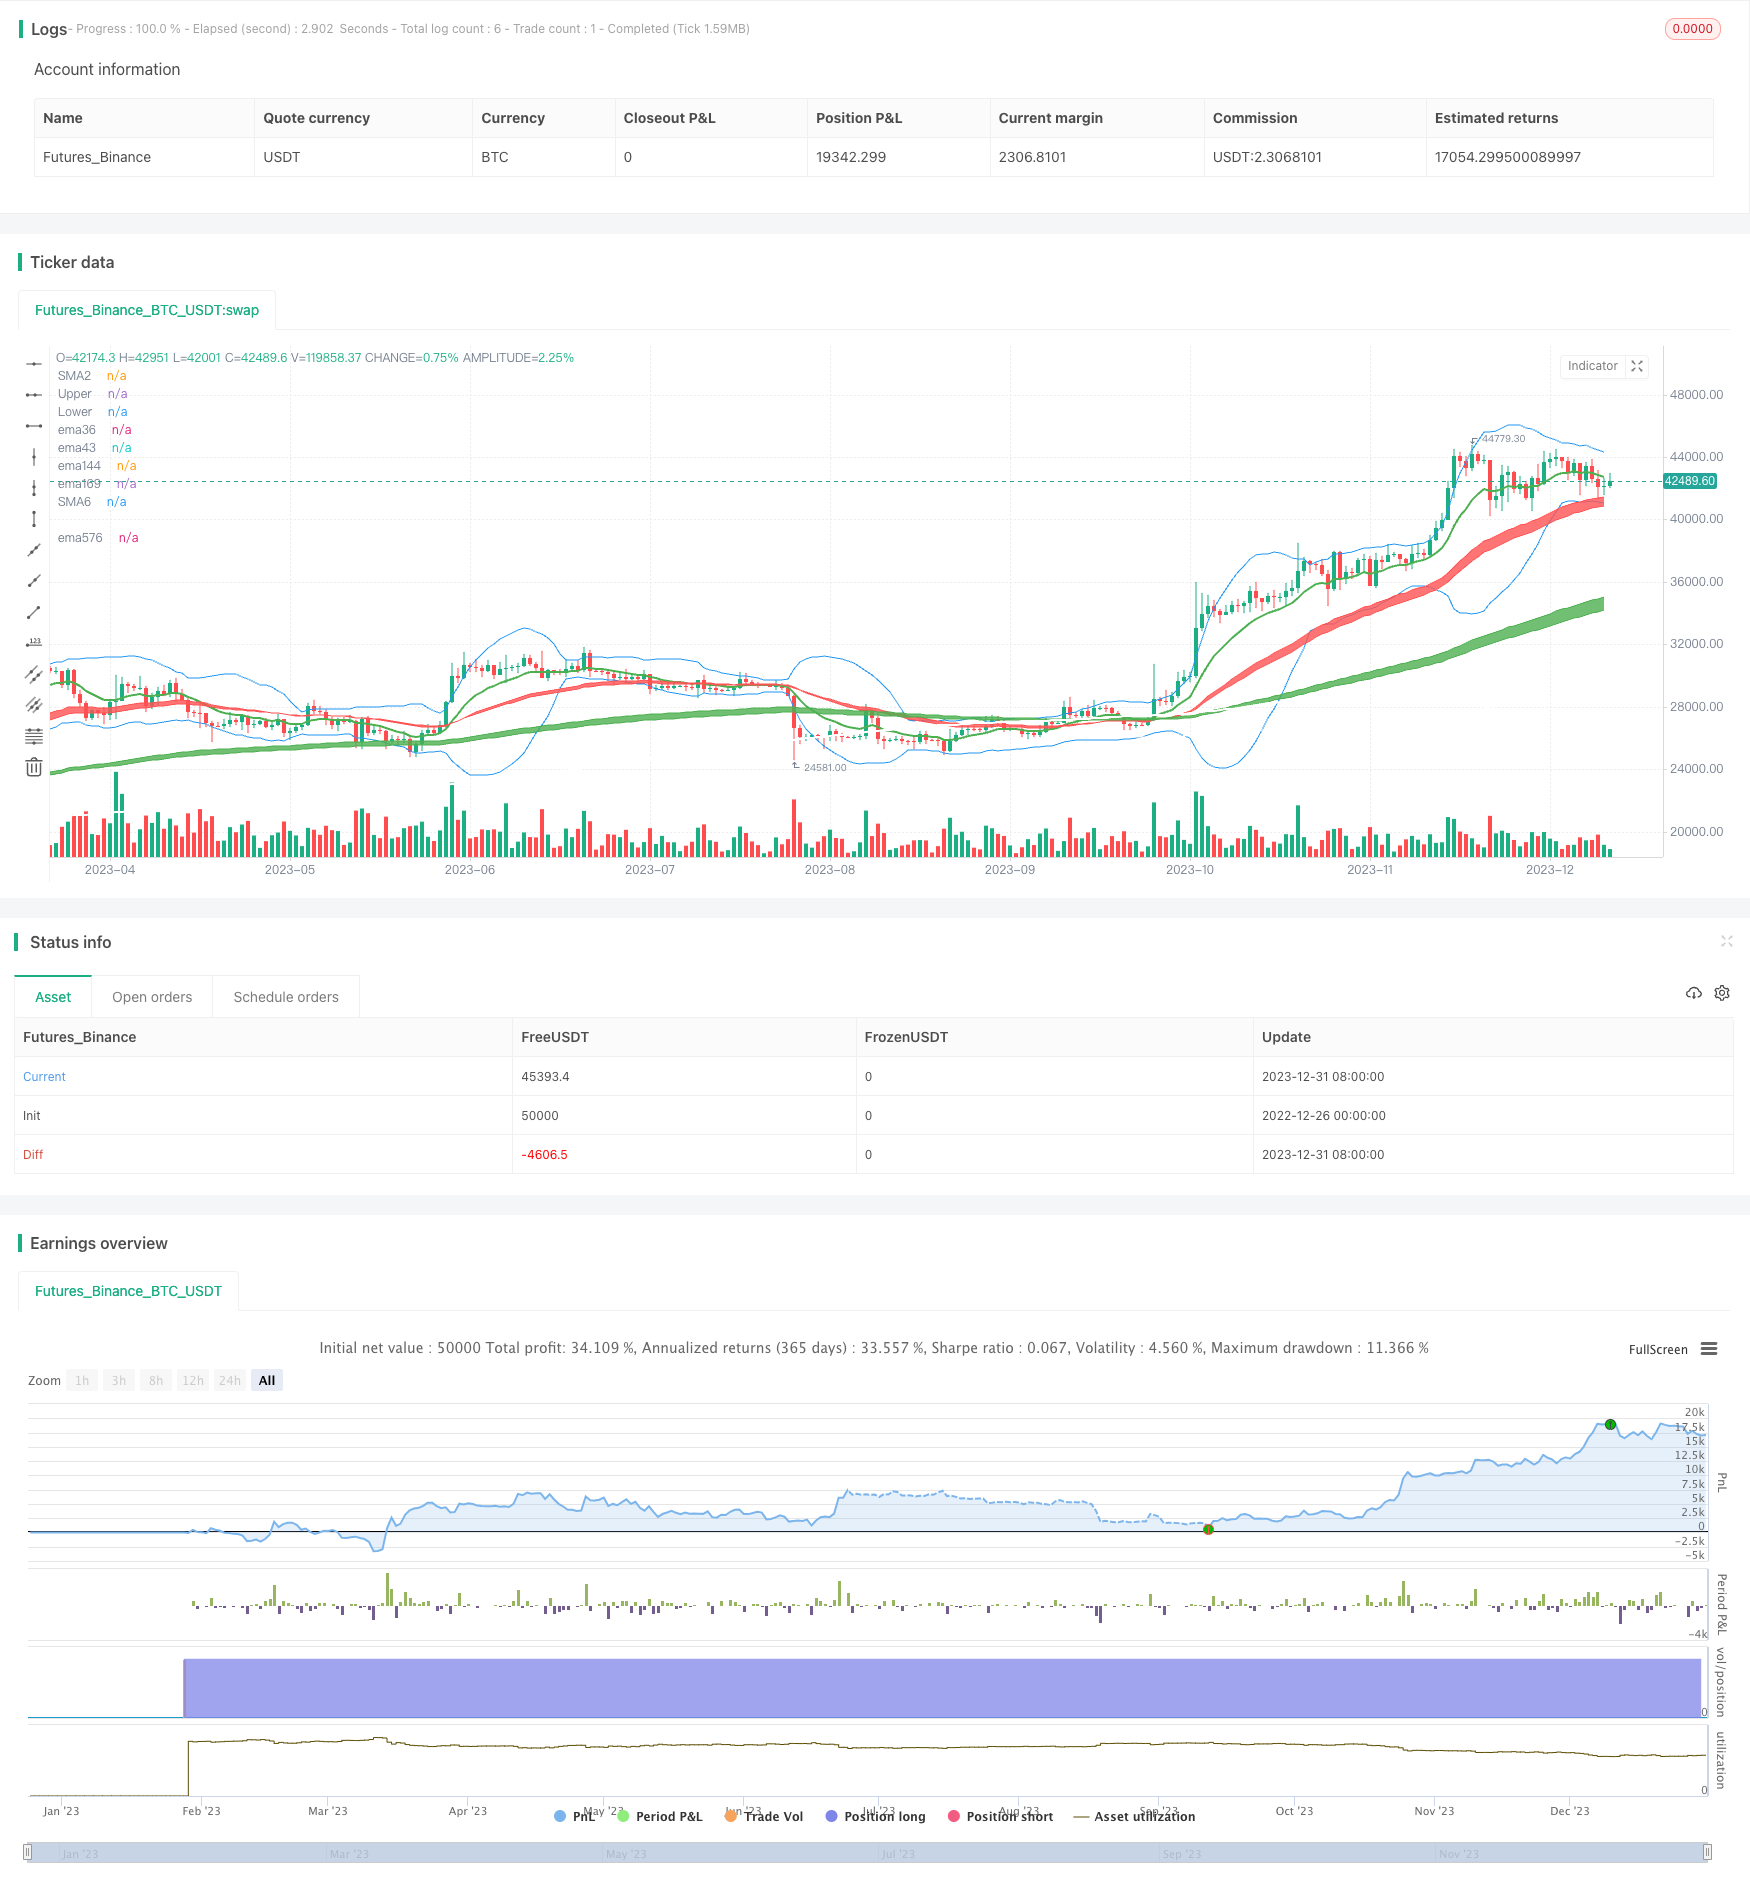
Strategi Vegas Tunnel adalah sebagai berikut:
- Menggunakan EMA36 dan EMA43 untuk membuat penilaian tren jangka pendek, yang membentuk saluran merah;
- Menggunakan EMA144 dan EMA169 untuk membuat penilaian tren jangka menengah, yang membentuk saluran hijau;
- Menggunakan EMA576 dan EMA676 untuk membuat penilaian tren jangka panjang, yang membentuk saluran abu-abu;
- Ketika harga berdiri di garis rata-rata EMA, Anda dapat melakukan lebih banyak, dan kemudian menggabungkan indikator MACD untuk melakukan sinyal beli yang menerobos ke atas pada sumbu nol;
- Ketika harga jatuh di setiap garis rata-rata EMA, maka bisa melakukan shorting, kemudian digabungkan dengan MACD indikator ke bawah untuk menerobos 0 dan mengirimkan sinyal jual.
- Ada tiga strategi perdagangan yang dibagi menjadi pendek dan panjang berdasarkan periode rata-rata EMA yang melintasi, masing-masing sesuai dengan periode kepemilikan yang berbeda.
Keuntungan dari strategi ini adalah:
- Pada saat yang sama, tiga saluran penilaian arah tren, yang terdiri dari saluran pendek, menengah, dan panjang, relatif stabil.
- Vegas Channel jelas, intuitif, dan mudah untuk menilai tren.
- Dengan kombinasi indikator MACD, Anda dapat mengidentifikasi waktu yang tepat untuk membeli dan menjual.
- Ini adalah tiga strategi yang dapat digunakan untuk lebih fleksibel dalam operasi.
Risiko utama dari strategi ini adalah:
- Pada saat harga saham berfluktuasi tajam, rata-rata EMA terbelakang, sehingga kemungkinan besar terjadi kesalahan penilaian.
- Jika tiga saluran tersebut tidak bertepatan, ada risiko kesalahan operasi.
- Mengoperasikan peta waktu membutuhkan daya tahan mental yang kuat.
Cara Mengatasinya:
- Periode rata-rata EMA dapat disesuaikan sesuai dengan karakteristik pasar saat ini.
- Mengatur rasio kepemilikan sebelum perdagangan, untuk mengendalikan kerugian tunggal.
Strategi ini memiliki ruang untuk optimasi:
- Untuk membedakan tren di Vegas Tunnel tidak cukup, dapat diperkenalkan penilaian tambahan di Brink’s Tunnel.
- Indikator MACD tidak bekerja dengan baik untuk pergerakan bergejolak di antara zona, dapat diganti dengan indikator seperti KD, RSI.
- Menambahkan strategi stop loss, seperti stop loss aktif saat harga menutup di bawah EMA kunci.
- A saham yang jatuh dan turun sangat berpengaruh, dapat dipertimbangkan untuk melakukan shorting ETF.
/*backtest
start: 2022-12-26 00:00:00
end: 2024-01-01 00:00:00
period: 1d
basePeriod: 1h
exchanges: [{"eid":"Futures_Binance","currency":"BTC_USDT"}]
*/

//@version=4

strategy("Vegas Tunnel strategy", overlay=true)
//-------------------------------------------
//-------------------------------------------
// Inputs
useCurrentRes = input(true, title="Use Current Chart Resolution?")
resCustom = input(title="Use Different Timeframe? Uncheck Box Above", type=input.resolution, defval="D")
//tfSet = input(title = "Time Frame", options=["Current","120", "240", "D", "W"], defval="D")
tfSet = useCurrentRes ? timeframe.period : resCustom
maPeriods2 = input(12, "12 EMA")
maPeriods6 = input(240, "240 SMA")
BBlength = input(20, title="BB Length", minval=1)
BBsrc = input(close, title="BB Source")
mult = input(2.0, minval=0.001, maxval=50, title="BB StdDev")
sm2 = security(syminfo.tickerid, tfSet, ema(close, maPeriods2))
sm6 = security(syminfo.tickerid, tfSet, sma(close, maPeriods6))
p2 = plot(sm2, color=color.green, transp=30,  linewidth=2, title="SMA2")
p6 = plot(sm6, color=color.white, transp=30,  linewidth=2, title="SMA6")
//BB
basis = sma(BBsrc, BBlength)
dev = mult * stdev(BBsrc, BBlength)
upper = basis + dev
lower = basis - dev
offset = input(0, "BB Offset", type = input.integer, minval = -500, maxval = 500)
//plot(basis, "Basis", color=color.blue,linewidth, offset = offset)
pBB1 = plot(upper, "Upper", color=color.blue, offset = offset)
pBB2= plot(lower, "Lower", color=color.blue, offset = offset)

//MACD
fast_ma = ema(close, 48)
slow_ma = ema(close, 56)
macd = fast_ma - slow_ma

//vagas隧道
f1=ema(close, 36)
f2=ema(close, 43)
f3=ema(close, 144)
f4=ema(close, 169)
f5=ema(close, 576)
f6=ema(close, 676)
f7=ema(close,2304)
z1=plot(f1,color=color.red, title="ema36",transp=100)
z2=plot(f2,color=color.red, title="ema43",transp=100)
z3=plot(f3,color=color.green, title="ema144",transp=100)
z4=plot(f4,color=color.green, title="ema169",transp=100)
z5=plot(f5,color=color.white, title="ema576",transp=100)
z6=plot(f6,color=color.white, title="ema676",transp=100)
fill(z1, z2, color=color.red,transp=60)
fill(z3, z4, color=color.green,transp=60)
fill(z5, z6, color=color.gray,transp=60)

// Make input options that configure backtest date range
startDate = input(title="Start Date", type=input.integer,
     defval=1, minval=1, maxval=31)
startMonth = input(title="Start Month", type=input.integer,
     defval=1, minval=1, maxval=12)
startYear = input(title="Start Year", type=input.integer,
     defval=2018, minval=1800, maxval=2100)
endDate = input(title="End Date", type=input.integer,
     defval=1, minval=1, maxval=31)
endMonth = input(title="End Month", type=input.integer,
     defval=11, minval=1, maxval=12)
endYear = input(title="End Year", type=input.integer,
     defval=2030, minval=1800, maxval=2100)
// Look if the close time of the current bar
// falls inside the date range
inDateRange =  true

//波段多
if (inDateRange and crossunder(f3,f1))//
    strategy.entry("buy", strategy.long,1, when=macd>0, comment = "買Long-term")
buyclose=crossunder(f3,f5)
strategy.close("buy", when = buyclose, comment = "關Long-term")
//多策略1
if (inDateRange and crossover(low , f3) and macd>0 and f3>f6)
    strategy.entry("buy1", strategy.long,100, comment = "買Mid-term")
buyclose1=crossunder(close,upper*0.999)
if (macd<0 or f3<f6)
    strategy.close("buy1", comment = "關Mid-term")
//strategy.close("buy1",when=cross(basis,close), comment = "關M",qty_percent=50)
strategy.close("buy1", when = buyclose1, comment = "關Mid-term",qty_percent=100)
//多策略3
if (inDateRange and  (macd>0) and crossunder(low,f1) and f1>f4) //
    strategy.entry("buy3", strategy.long,1, comment = "買Short-term")
buyclose3=crossunder(close,upper*0.999)
if (macd<0 or f1<f4)
    strategy.close("buy3", comment = "關Short-term")
strategy.close("buy3", when = buyclose3, comment = "關Short-term")
//多策略4
if (inDateRange and  (macd>0) and crossunder(low,f5) and f4>f5) //
    strategy.entry("buy4", strategy.long,1, comment = "買Long-term")
buyclose4=crossunder(close,upper*0.999)
if (macd<0 or f4<f6)
    strategy.close("buy4", comment = "關Long-term")
strategy.close("buy4", when = buyclose4, comment = "關Long-term")

//空策略1
if (inDateRange and  (macd<0) and crossunder(high,f1) and f1<f3 and f3<f6) //
    strategy.entry("sell1", strategy.short,1, comment = "空Short-term")
sellclose1=crossunder(lower*0.999,close)
if (macd>0 or f1>f4)
    strategy.close("sell1", comment = "關空Short-term")
strategy.close("sell1", when = sellclose1, comment = "關空Short-term")
//空策略2
if (inDateRange and  (macd<0) and crossunder(high,f4) and f4<f6) //
    strategy.entry("sell2", strategy.short,1, comment = "空Mid-term")
sellclose2=crossunder(lower,close)
if (macd>0 or f4>f6)
    strategy.close("sell2", comment = "關空Mid-term")
strategy.close("sell2", when = sellclose2, comment = "關Mid-term")
//空策略3
if (inDateRange and (macd<0) and crossunder(high,f6)) //
    strategy.entry("sell3", strategy.short,1, comment = "空Long-term")
sellclose3=crossunder(lower,close)
if (macd>0 or f6>f7)
    strategy.close("sell3", comment = "關空Long-term")
strategy.close("sell3", when = sellclose3, comment = "關空Long-term")