Strategi mengikuti tren berdasarkan Average True Range
Ringkasan
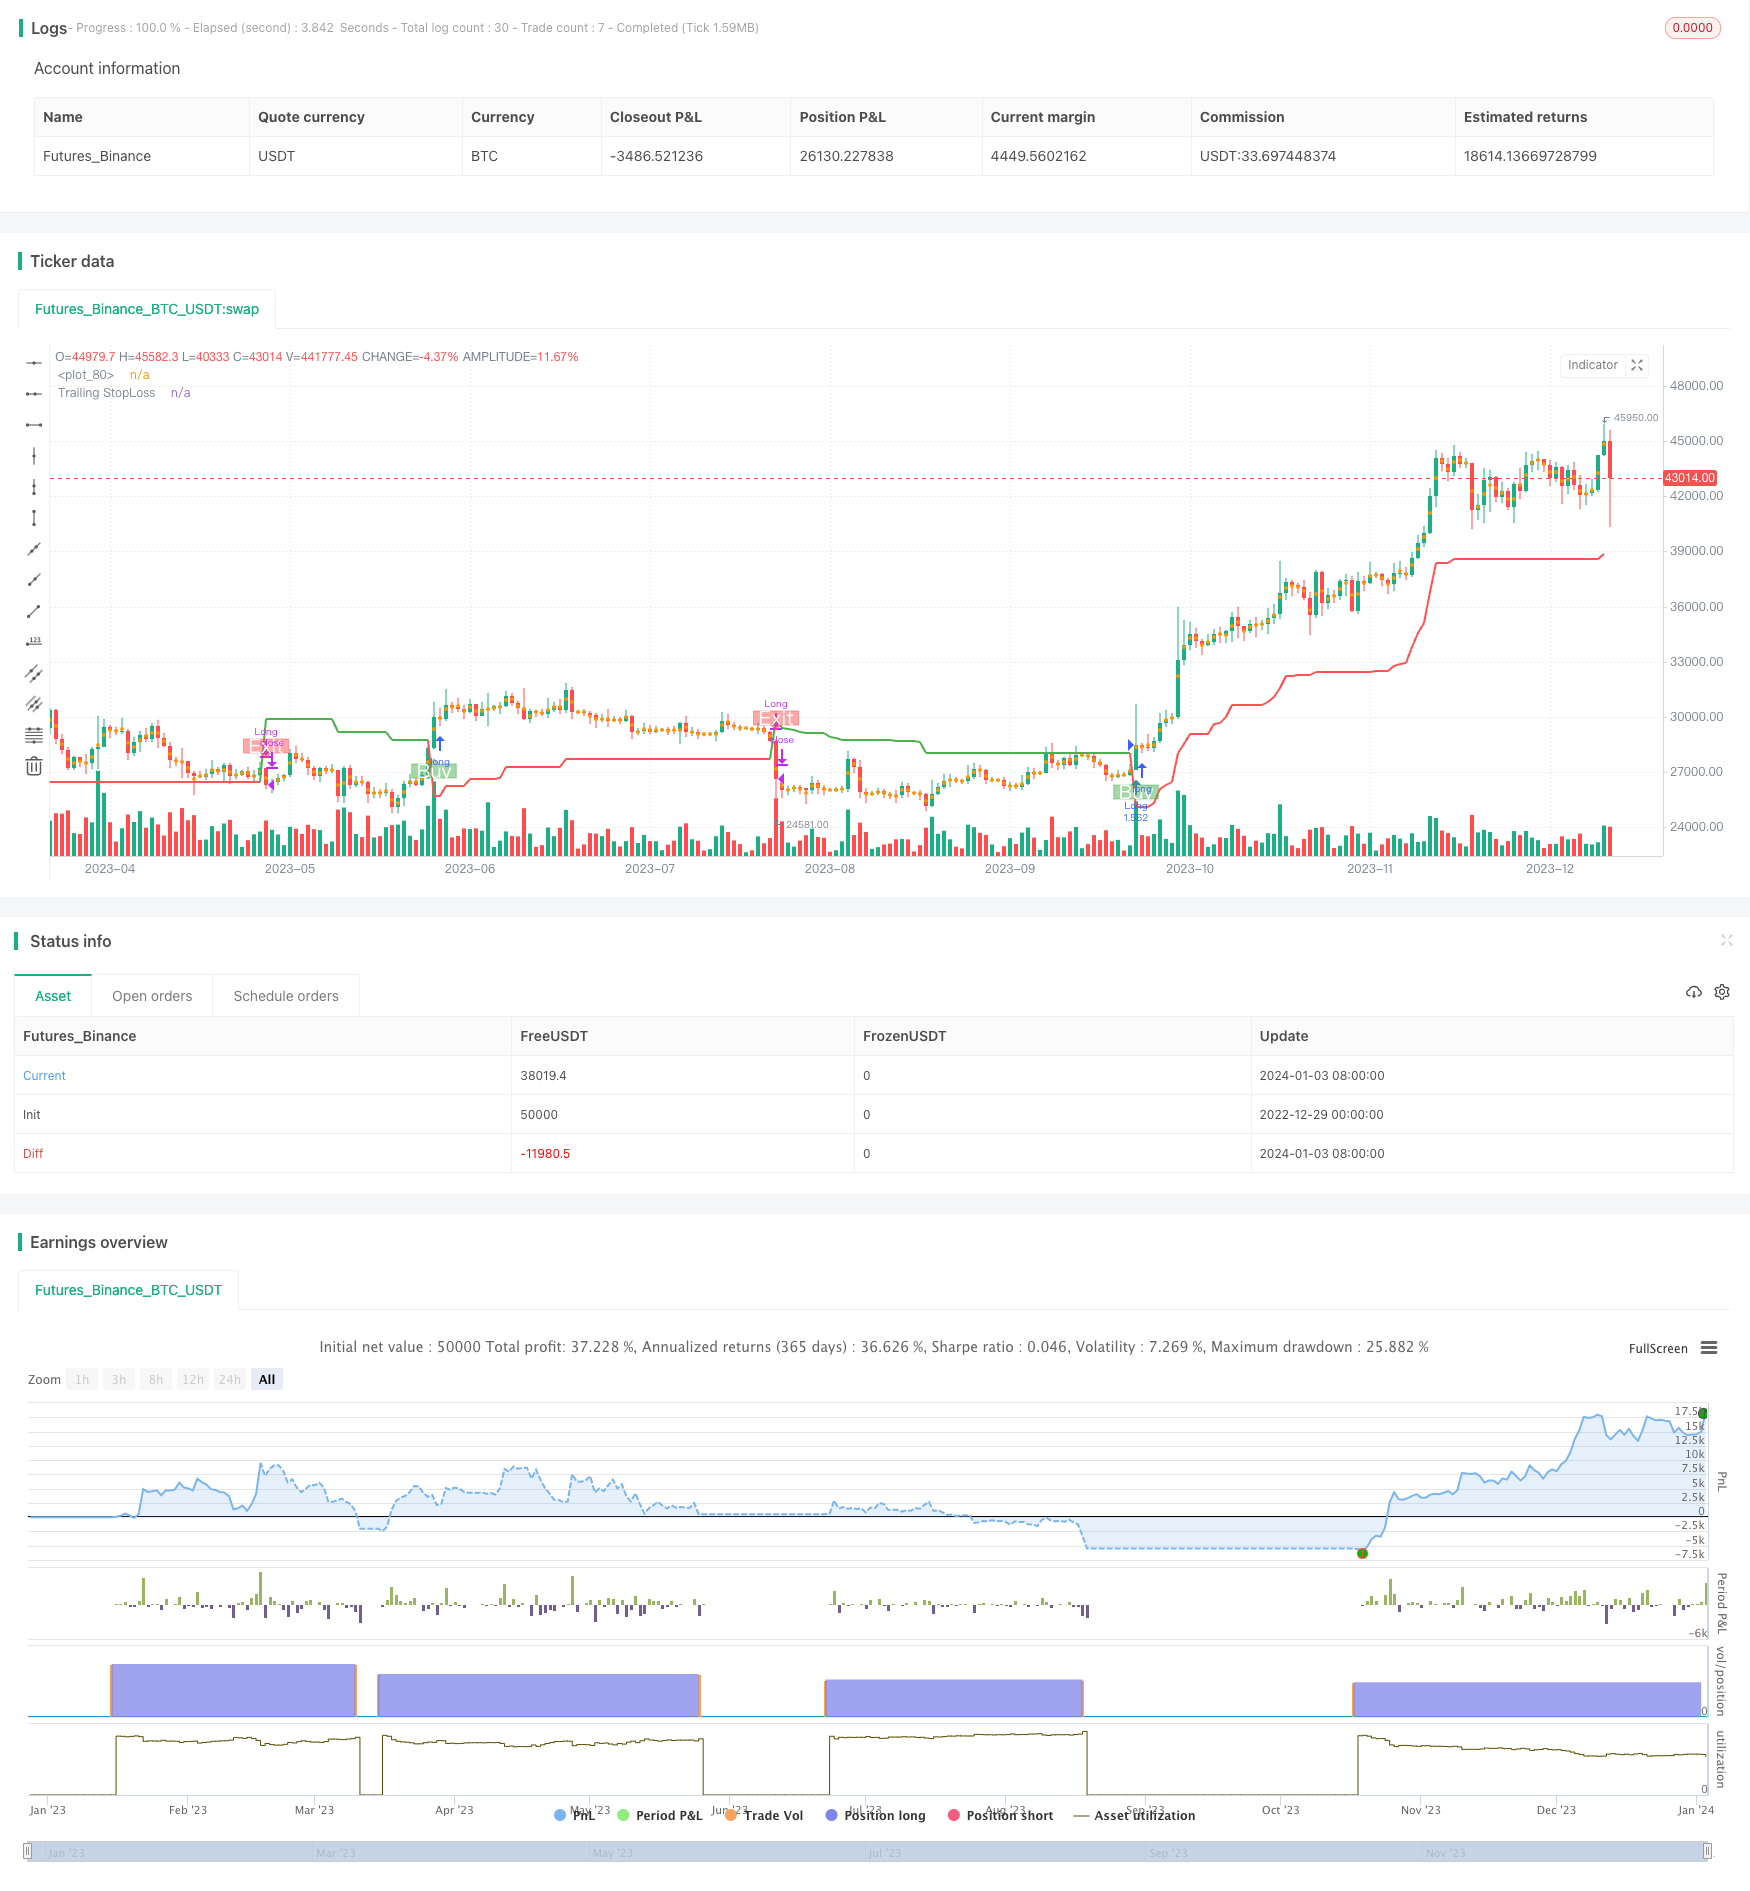
Strategi ini adalah strategi pelacakan tren yang didasarkan pada rata-rata amplitudo real (ATR). Strategi ini menggunakan ATR untuk menghitung nilai indikator, sehingga menentukan arah tren harga. Strategi ini juga menyediakan mekanisme stop loss untuk mengendalikan risiko.
Prinsip Strategi
Strategi ini menggunakan tiga parameter utama: Periode, Multiplier, dan Entry/Exit Point. Parameter default adalah ATR 14 periode dan 4 kali lipat dari kalibrasi.
Strategi ini pertama-tama menghitung harga rata-rata multihead ((buyavg) dan harga rata-rata headless ((sellavg), lalu membandingkan harga dengan hubungan kedua harga rata-rata tersebut untuk menentukan arah tren saat ini. Jika harga lebih tinggi dari harga rata-rata headless, dinilai sebagai multihead; Jika harga lebih rendah dari harga rata-rata headless, dinilai sebagai headless.
Selain itu, strategi ini digabungkan dengan ATR untuk mengatur Trailing Stop Loss. Metode spesifiknya adalah: dengan ATR 14 siklus rata-rata bergerak berbobot dikali satu kali lipat (default 4) sebagai jarak berhenti.
Ketika stop loss dipicu, strategi ini akan merata untuk menghasilkan keuntungan.
Keunggulan Strategis
- Berdasarkan penilaian tren, dapat berjalan dengan baik dan terus menghasilkan keuntungan
- Menggunakan ATR untuk menyesuaikan jarak stop loss secara dinamis untuk mengontrol risiko secara efektif
- Perhitungan titik jual beli sederhana dan mudah dipahami
Risiko dan Pengendalian
- Jika tren berubah, kemungkinan kerugian yang lebih besar
- Siklus ATR dan perkalian disesuaikan untuk mengoptimalkan jarak stop loss
- WILL mengalami kerugian kecil dalam beberapa peristiwa gempa.
- Meningkatkan kondisi penyaringan untuk menghindari pasar yang bergoyang
- Parameter yang tidak tepat dapat menyebabkan efek kebijakan yang buruk
- Tes optimasi parameter multi-kombinasi untuk menemukan parameter optimal
Arah optimasi strategi
- Menambahkan indikator lain untuk menilai sinyal penyaringan dan menghindari masuk dalam situasi getaran
- Optimalkan siklus ATR dan parameter perkalian untuk membuat jarak stop loss lebih masuk akal
- Menambahkan kontrol posisi terbuka, menyesuaikan ukuran posisi sesuai dengan kondisi pasar
Meringkaskan
Strategi ini secara keseluruhan merupakan strategi pelacakan tren yang sederhana dan praktis. Strategi ini hanya membutuhkan sedikit parameter yang dapat diimplementasikan, dengan stop loss yang disesuaikan secara dinamis melalui ATR, yang dapat secara efektif mengendalikan risiko. Strategi ini dapat dioptimalkan lebih lanjut, memfilter beberapa sinyal noise jika dikombinasikan dengan indikator penilaian tambahan lainnya. Secara keseluruhan, strategi ini cocok untuk mereka yang ingin mempelajari strategi pelacakan tren, dan dapat digunakan sebagai komponen dasar untuk strategi lanjutan lainnya.
/*backtest
start: 2022-12-29 00:00:00
end: 2024-01-04 00:00:00
period: 1d
basePeriod: 1h
exchanges: [{"eid":"Futures_Binance","currency":"BTC_USDT"}]
*/

//@version=5
strategy('Trend Strategy by zdmre', shorttitle='Trend Strategy', overlay=true, pyramiding=0, currency=currency.USD, default_qty_type=strategy.percent_of_equity, initial_capital=10000, default_qty_value=100, commission_type=strategy.commission.percent, commission_value=0.005)
show_STOPLOSSprice = input(true, title='Show TrailingSTOP Prices')
src = input(close, title='Source')
out2 = ta.ema(src, 20)

buyavg = (close + high) / 2.02 - high * (1 - open / close) * (1 - low * open / (high * close))
sellavg = ((low + close) / 1.99 + low * (1 - low / open) * (1 - low * open / (close * high)) / 1.1 + out2 )/ 2

// === INPUT BACKTEST RANGE ===
fromMonth = input.int(defval=1, title='From Month', minval=1, maxval=12)
fromDay = input.int(defval=1, title='From Day', minval=1, maxval=31)
fromYear = input.int(defval=2021, title='From Year', minval=1970)
thruMonth = input.int(defval=1, title='Thru Month', minval=1, maxval=12)
thruDay = input.int(defval=1, title='Thru Day', minval=1, maxval=31)
thruYear = input.int(defval=2100, title='Thru Year', minval=1970)

// === INPUT SHOW PLOT ===
showDate = input(defval=true, title='Show Date Range')

// === FUNCTION EXAMPLE ===
start = timestamp(fromYear, fromMonth, fromDay, 00, 00)  // backtest start window
finish = timestamp(thruYear, thruMonth, thruDay, 23, 59)  // backtest finish window
window() => true


// === TRAILING STOP LOSS === //

ATR_Period = input(14)
ATR_Mult = input(4.0)
var float ATR_TrailSL = na
var int pos = na
atr = ta.rma (ta.tr(true), 14)
xATR = ta.atr(ATR_Period)
nLoss = ATR_Mult * xATR

iff_1 = close > nz(ATR_TrailSL[1], 0) ? close - nLoss : close + nLoss
iff_2 = close < nz(ATR_TrailSL[1], 0) and close[1] < nz(ATR_TrailSL[1], 0) ? math.min(nz(ATR_TrailSL[1]), close + nLoss) : iff_1
ATR_TrailSL := close > nz(ATR_TrailSL[1], 0) and close[1] > nz(ATR_TrailSL[1], 0) ? math.max(nz(ATR_TrailSL[1]), close - nLoss) : iff_2

iff_3 = close[1] > nz(ATR_TrailSL[1], 0) and close < nz(ATR_TrailSL[1], 0) ? -1 : nz(pos[1], 0)
pos := close[1] < nz(ATR_TrailSL[1], 0) and close > nz(ATR_TrailSL[1], 0) ? 1 : iff_3

atr_color = pos == -1 ? color.green : pos == 1 ? color.red : color.aqua
atrtrend = plot(ATR_TrailSL, 'Trailing StopLoss', atr_color, linewidth=2)

// ===  Stop Loss === //
slGroup = 'Stop Loss'
useSL = input.bool(false, title='╔══════   Enable   ══════╗', group=slGroup, tooltip='If you are using this strategy for Scalping or Futures market, we do not recommend using Stop Loss.')
SLbased = input.string(title='Based on', defval='Percent', options=['ATR', 'Percent'], group=slGroup, tooltip='ATR: Average True Range\nPercent: eg. 5%.')
multiATR = input.float(10.0, title='ATR   Mult', group=slGroup, inline='atr')
lengthATR = input.int(14, title='Length', group=slGroup, inline='atr')
SLPercent = input.float(5, title='Percent', group=slGroup) * 0.01
Shortposenter = input.bool(false, title='ShortPosition')

longStop = 0.0
shortStop = 0.0

if SLbased == 'ATR'
    longStop := ta.valuewhen(pos == 1, low, 0) - ta.valuewhen(pos == 1, ta.rma(ta.tr(true), lengthATR), 0) * multiATR
    longStopPrev = nz(longStop[1], longStop)
    longStop := close[1] > longStopPrev ? math.max(longStop, longStopPrev) : longStop

    shortStop := ta.valuewhen(pos == -1, ta.rma(ta.tr(true), lengthATR), 0) * multiATR + ta.valuewhen(pos == -1, high, 0)
    shortStopPrev = nz(shortStop[1], shortStop)
    shortStop := close[1] > shortStopPrev ? math.max(shortStop, shortStopPrev) : shortStop
    shortStop
if SLbased == 'Percent'
    longStop := strategy.position_avg_price * (1 - SLPercent)
    shortStop := strategy.position_avg_price * (1 + SLPercent)
    shortStop
exitLong  = pos == -1

// === PlotColor === //
buySignal = pos == 1 and pos[1] == -1
plotshape(buySignal, title="Long", location=location.belowbar, style=shape.labelup, size=size.normal, color=color.new(color.green,50), text='Buy', textcolor=color.white)
exitSignal = pos == -1 and pos[1] == 1
plotshape(exitSignal, title="Exit", location=location.abovebar, style=shape.labeldown, size=size.normal, color=color.new(color.red,50), text='Exit', textcolor=color.white)

hPlot = plot(ohlc4, title="", style=plot.style_circles, linewidth=0, editable = false)
longFill = (pos == 1 ? color.new(color.green,80) : na)
shortFill = (pos == -1 ? color.new(color.red,80) : na)
fill(hPlot, atrtrend,color=longFill)
fill(hPlot,atrtrend, color=shortFill)

// === Strategy === //
strategy.entry('Long', strategy.long,limit = buyavg, when=window() and pos == 1,comment="Entry: "+str.tostring(buyavg))
strategy.close('Long', when=window() and exitLong , comment='Exit: '+str.tostring(sellavg) )

if Shortposenter
    strategy.entry('Short', strategy.short, when=window() and pos== -1,comment="Entry: "+str.tostring(close))
    strategy.close('Short', when=window() and pos == 1 , comment='Exit: ')

if useSL
    strategy.exit('Stop Loss', 'Long', stop=longStop)

// === Show StopLoss Price === //
if show_STOPLOSSprice
    if pos == -1
        label ShortStop = label.new(bar_index, na, 'SL: ' + str.tostring(ATR_TrailSL), color=color.green, textcolor=color.white, style=label.style_none, yloc=yloc.abovebar, size=size.small)
        label.delete(ShortStop[1])

    if pos == 1
        label LongStop = label.new(bar_index, na, 'SL: ' + str.tostring(ATR_TrailSL), color=color.red, textcolor=color.white, style=label.style_none, yloc=yloc.belowbar, size=size.small)
        label.delete(LongStop[1])