Strategi Peningkatan Tren Mengikuti Momentum Breakout Tren
Ringkasan
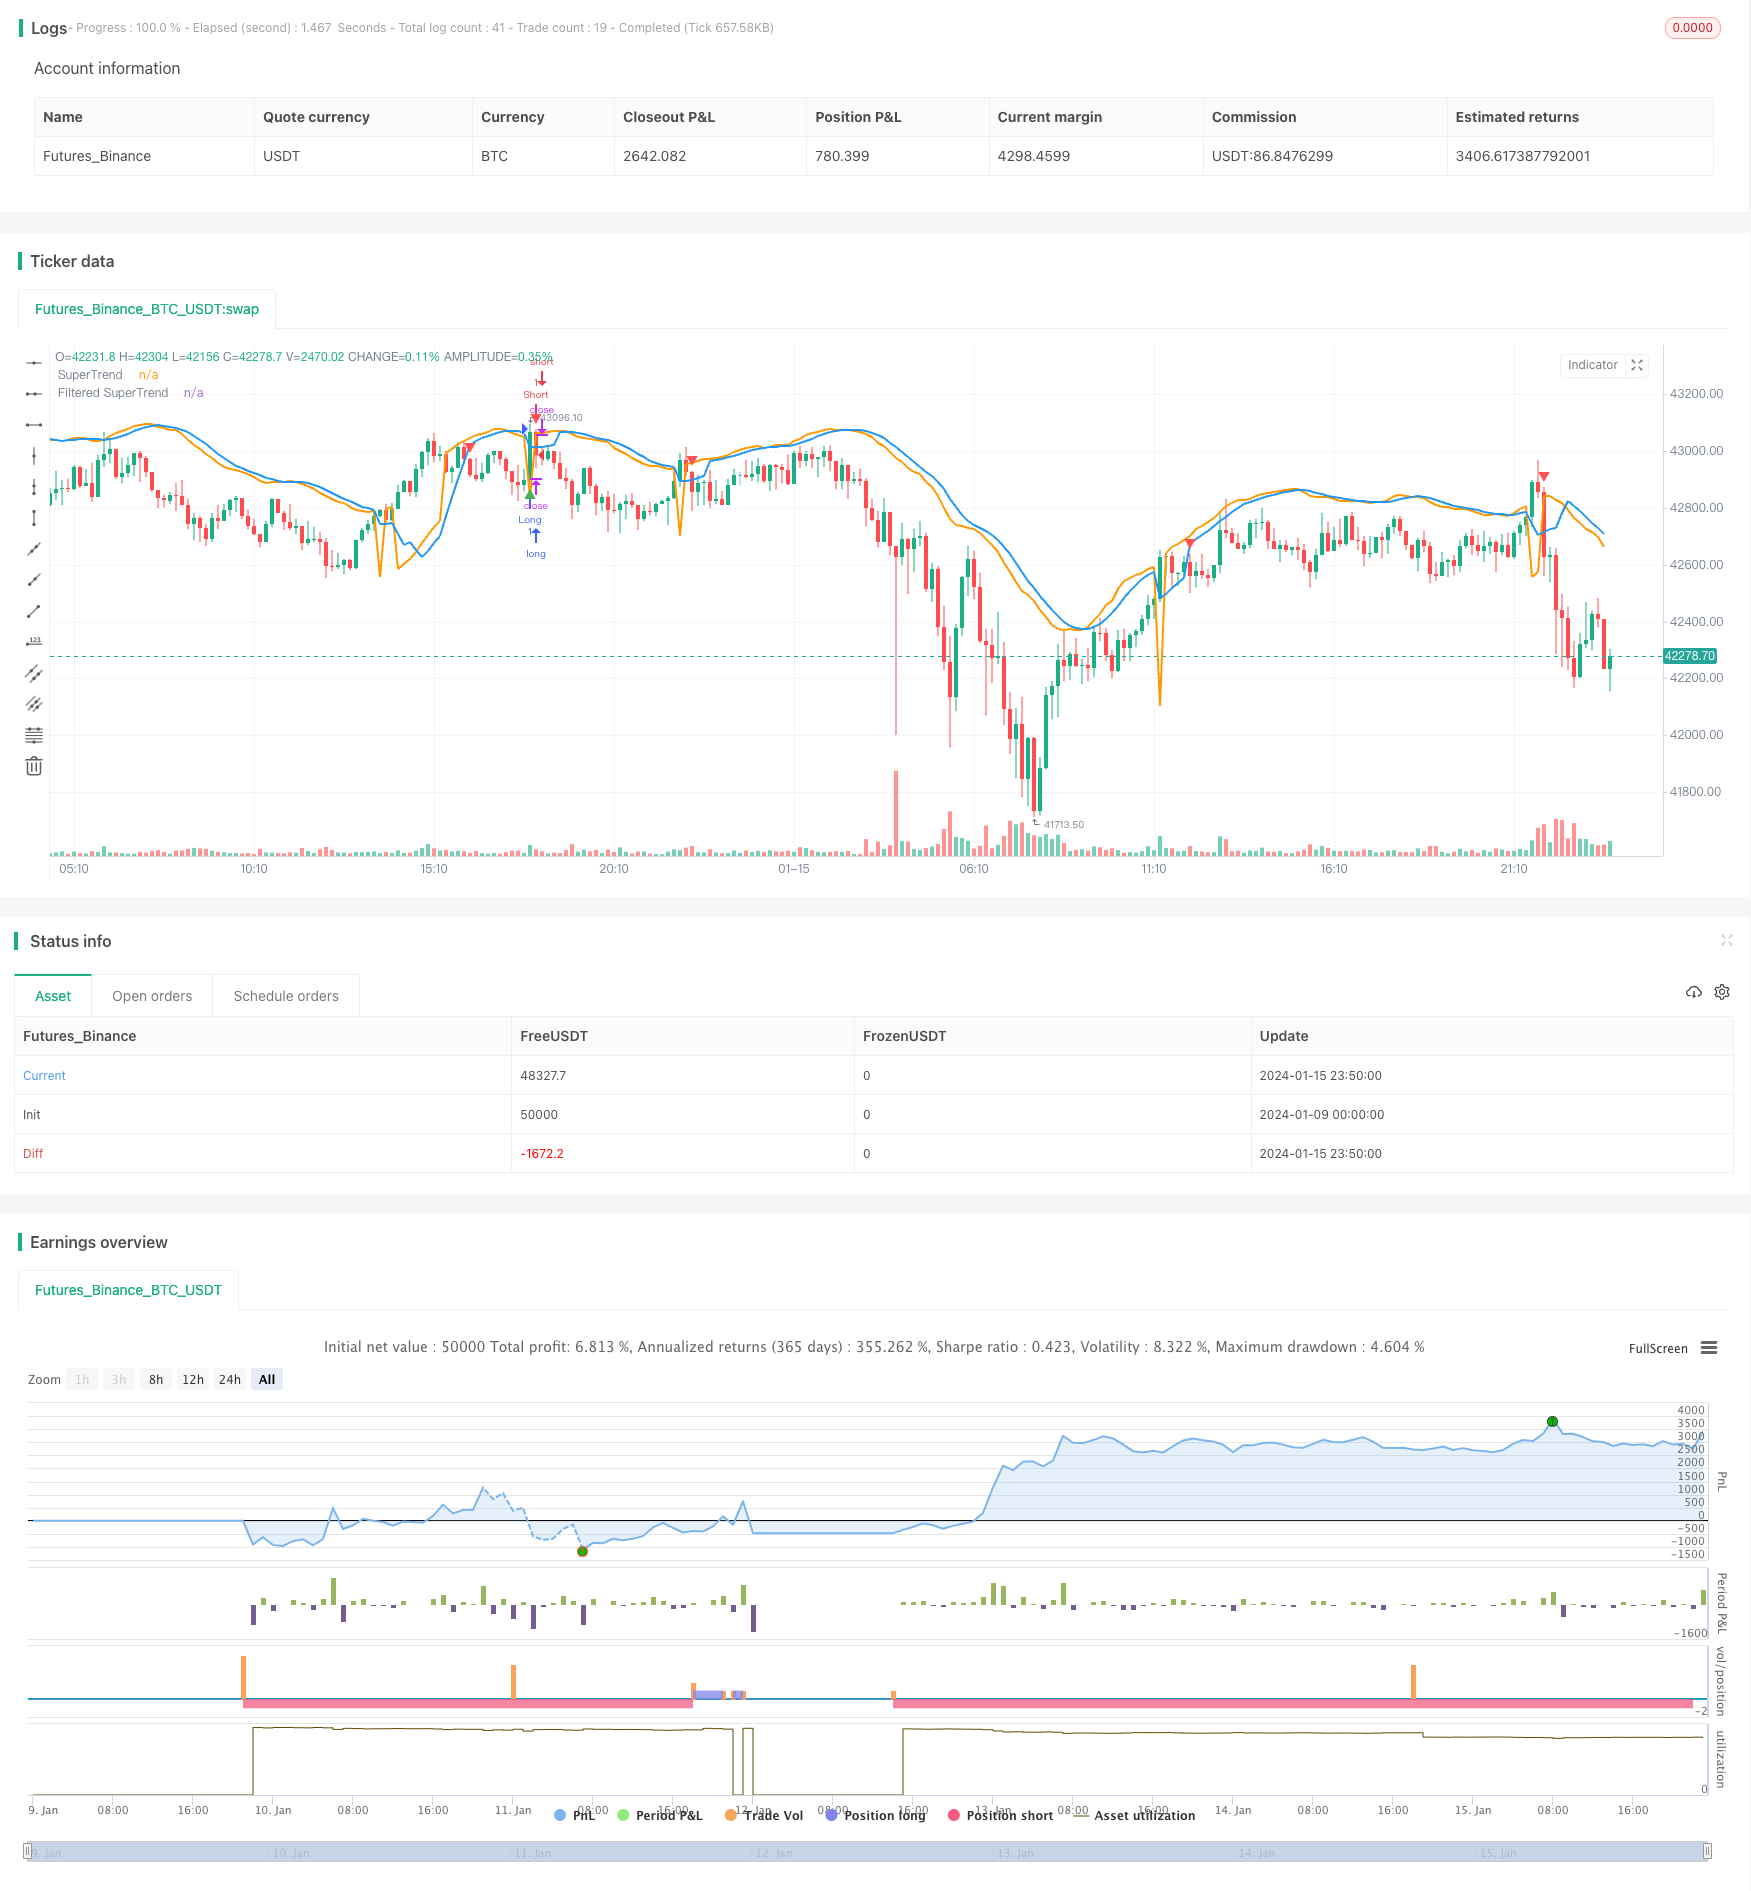
Artikel ini menganalisis secara rinci strategi pelacakan tren yang ditingkatkan yang menggabungkan indikator SuperTrend dan filter Stochastic RSI. Strategi ini bertujuan untuk menghasilkan sinyal beli dan jual sambil mempertimbangkan tren pasar dan mengurangi sinyal palsu.
Prinsip Strategi
Perhitungan SuperTrend
Pertama, perhitungkan real range of fluctuation (TR) dan average real range of fluctuation (ATR). Lalu gunakan ATR untuk perhitungan up-track dan down-track:
Uptrend = SMA ((harga tutup, siklus ATR) + ATR kali × ATR Jalur bawah = SMA ((harga tutup, siklus ATR) - ATR kali × ATR
Jika harga penutupan lebih tinggi dari downtrend, maka tren naik; jika harga penutupan lebih rendah dari uptrend, maka tren turun. Dalam tren naik, SuperTrend adalah downtrend; dalam tren turun, SuperTrend adalah uptrend.
Mekanisme penyaringan
Untuk mengurangi sinyal palsu, SuperTrend diperlakukan sebagai moving average untuk mendapatkan SuperTrend yang telah disaring.
Stochastic RSI
Menghitung nilai RSI, kemudian menerapkan indikator Stokastik untuk menghasilkan RSI Stokastik. Ini mencerminkan apakah RSI berada di zona overbought atau oversold.
Syarat masuk dan keluar
Kondisi pembelian: harga close out di atas SuperTrend yang telah melintasi rantai dan berada dalam tren naik, dan Stochastic RSI < 80 Kondisi Penjualan: harga close out di bawah SuperTrend yang telah melintasi titik terendah dan berada dalam tren menurun, dan Stochastic RSI > 20
Keluar dari pembelian: harga penutupan di bawah SuperTrend yang telah melewati titik terendah dan sedang naik Penarikan dan Penjualan: Penutupan harga setelah melewati SuperTrend dan berada dalam tren menurun
Keunggulan Strategis
Ini adalah strategi pelacakan tren yang lebih baik dan memiliki beberapa keuntungan dibandingkan dengan indikator seperti Moving Average:
- SuperTrend sendiri memiliki kemampuan yang lebih kuat untuk mengidentifikasi tren dan memfilter sinyal palsu.
- Aplikasi mekanisme penyaringan mengurangi sinyal palsu lebih lanjut, membuat sinyal lebih dapat diandalkan.
- Stochastic RSI menghindari sinyal palsu yang dihasilkan dalam kasus overbought dan oversold, memungkinkan strategi untuk mengirim sinyal di dekat area resistensi pendukung yang penting.
- Strategi ini memperhitungkan arah tren dan overbought dan oversold pada Stochastic RSI untuk menyeimbangkan hubungan antara mengikuti tren dan menghindari sinyal palsu.
- Parameter strategi dapat disesuaikan secara fleksibel untuk kondisi pasar yang berbeda.
Risiko dan Optimalisasi Strategi
Risiko yang mungkin
- Dalam pasar yang sangat bergejolak, stop loss dapat ditembus.
- SuperTrend dan mekanisme penyaringan terlambat dan mungkin tidak melihat perubahan harga terbaru.
- Tidak tepatnya pengaturan parameter Stochastic RSI juga dapat mempengaruhi kinerja strategi.
Pengelolaan risiko
- Stop loss yang disesuaikan, atau menggunakan stop loss yang tidak sesuai.
- Sesuaikan parameter ATR siklus, siklus filter untuk menyeimbangkan keterbelakangan.
- Tes dan optimasi parameter Stochastic RSI.
Arah optimasi
- Uji kombinasi parameter yang berbeda untuk mencari parameter yang optimal.
- Cobalah berbagai mekanisme penyaringan, seperti EMA smoothing.
- Menggunakan algoritma pembelajaran mesin untuk mengoptimalkan parameter secara otomatis.
- Tergabung dengan indikator lain untuk melengkapi masuk berdasarkan.
Meringkaskan
Strategi ini menggabungkan keunggulan dari dua indikator SuperTrend dan Stochastic RSI, yang mampu mengidentifikasi tren secara efektif dan mengirimkan sinyal perdagangan berkualitas tinggi. Selain itu, mekanisme penyaringan juga membuatnya lebih robust terhadap kebisingan pasar. Strategi ini dapat memperoleh efek strategi yang lebih baik melalui pengoptimalan parameter, atau dapat dipertimbangkan untuk dikombinasikan dengan indikator atau model lain.
/*backtest
start: 2024-01-09 00:00:00
end: 2024-01-16 00:00:00
period: 10m
basePeriod: 1m
exchanges: [{"eid":"Futures_Binance","currency":"BTC_USDT"}]
*/

//@version=5
strategy("Improved SuperTrend Strategy with Stochastic RSI", shorttitle="IST+StochRSI", overlay=true)

// Input parameters
atr_length = input(14, title="ATR Length")
atr_multiplier = input(1.5, title="ATR Multiplier")
filter_length = input(5, title="Filter Length")
stoch_length = input(14, title="Stochastic RSI Length")
smooth_k = input(3, title="Stochastic RSI %K Smoothing")

// Calculate True Range (TR) and Average True Range (ATR)
tr = ta.rma(ta.tr, atr_length)
atr = ta.rma(tr, atr_length)

// Calculate SuperTrend
upper_band = ta.sma(close, atr_length) + atr_multiplier * atr
lower_band = ta.sma(close, atr_length) - atr_multiplier * atr

is_uptrend = close > lower_band
is_downtrend = close < upper_band

super_trend = is_uptrend ? lower_band : na
super_trend := is_downtrend ? upper_band : super_trend

// Filter for reducing false signals
filtered_super_trend = ta.sma(super_trend, filter_length)

// Calculate Stochastic RSI
rsi_value = ta.rsi(close, stoch_length)
stoch_rsi = ta.sma(ta.stoch(rsi_value, rsi_value, rsi_value, stoch_length), smooth_k)

// Entry conditions
long_condition = ta.crossover(close, filtered_super_trend) and is_uptrend and stoch_rsi < 80
short_condition = ta.crossunder(close, filtered_super_trend) and is_downtrend and stoch_rsi > 20

// Exit conditions
exit_long_condition = ta.crossunder(close, filtered_super_trend) and is_uptrend
exit_short_condition = ta.crossover(close, filtered_super_trend) and is_downtrend

// Plot SuperTrend and filtered SuperTrend
plot(super_trend, color=color.orange, title="SuperTrend", linewidth=2)
plot(filtered_super_trend, color=color.blue, title="Filtered SuperTrend", linewidth=2)

// Plot Buy and Sell signals
plotshape(series=long_condition, title="Buy Signal", color=color.green, style=shape.triangleup, location=location.belowbar)
plotshape(series=short_condition, title="Sell Signal", color=color.red, style=shape.triangledown, location=location.abovebar)

// Output signals to the console for analysis
plotchar(long_condition, "Long Signal", "▲", location.belowbar, color=color.green, size=size.small)
plotchar(short_condition, "Short Signal", "▼", location.abovebar, color=color.red, size=size.small)

// Strategy entry and exit
strategy.entry("Long", strategy.long, when=long_condition)
strategy.entry("Short", strategy.short, when=short_condition)
strategy.close("Long", when=exit_long_condition)
strategy.close("Short", when=exit_short_condition)