Strategi mengikuti tren trailing stop adaptif berdasarkan ATR dan RSI
Ringkasan
Strategi ini menggabungkan penggunaan jangkauan rata-rata real (ATR), indeks relative strength (RSI) dan stop loss bergerak untuk mencapai pelacakan tren yang beradaptasi. Menghitung stop loss dinamis melalui ATR, menggunakan RSI untuk menentukan arah tren pasar, dan stop loss bergerak mengikuti fluktuasi harga untuk memaksimalkan keuntungan. Ini adalah strategi pelacakan tren yang sangat khas.
Prinsip Strategi
Menghitung ATR. ATR mencerminkan volatilitas pasar dan tingkat risiko. Strategi ini menggunakan ATR untuk menghitung Stop Loss Dinamis dan mencapai Stop Loss Adaptif.
Perhitungan RSI. RSI dapat digunakan untuk menentukan fenomena overbought dan oversold di pasar. Jika RSI lebih besar dari 50, maka RSI adalah bullish. Jika RSI lebih kecil dari 50, maka RSI adalah bearish.
Stop loss bergerak. Strategi ini didasarkan pada stop loss yang dihitung oleh ATR dan arah tren yang dinilai oleh RSI, untuk mencapai stop loss bergerak terus melacak fluktuasi harga, dan secara bertahap memperluas stop loss sambil menjamin stop loss, untuk memaksimalkan keuntungan.
Secara khusus, ketika RSI lebih besar dari 50 untuk membuka posisi over, kurang dari 50 untuk membuka posisi kosong. Kemudian menggunakan stop loss yang dihitung oleh ATR untuk bergerak stop loss, untuk melacak pergerakan harga.
Analisis Keunggulan
Dengan menggunakan ATR untuk mengadaptasi stop loss, stop loss dapat disesuaikan sesuai dengan dinamika pasar yang berfluktuasi, menghindari stop loss yang terlalu besar dan terlalu kecil.
RSI menilai arah tren secara akurat dan dapat diandalkan, menghindari perdagangan yang terjebak di pasar yang bergoyang.
Stop loss mobile melacak fluktuasi harga, dapat memperluas stop loss, dan sepenuhnya melacak tren keuntungan.
Analisis risiko
Pengaturan parameter ATR dan RSI harus dioptimalkan melalui pengujian ulang, jika tidak, ini akan mempengaruhi efektivitas strategi.
Meskipun ada perlindungan stop loss, risiko terjatuhnya stop loss sangat sulit untuk dihindari. Posisi dapat dikurangi secara tepat untuk mengendalikan risiko.
Strategi ini sangat bergantung pada parameter yang dioptimalkan untuk varietas yang diperdagangkan, sehingga perlu menyesuaikan parameter untuk varietas yang berbeda.
Arah optimasi
Pertimbangan untuk menambahkan algoritma pembelajaran mesin untuk mengoptimalkan parameter adaptasi.
Menambahkan modul kontrol posisi, dapat menyesuaikan ukuran posisi secara dinamis sesuai dengan kondisi pasar, mengurangi probabilitas terobosan stop loss.
Meningkatkan indikator penilaian tren untuk menghindari kerugian yang disebabkan oleh kehilangan titik balik puncak bawah.
Meringkaskan
Strategi ini mengintegrasikan penggunaan modul seperti ATR, RSI, dan stop loss mobile untuk membentuk strategi pelacakan tren adaptif yang khas. Strategi pelacakan tren generik yang disarankan adalah strategi pelacakan tren generik yang sangat fleksibel yang dapat disesuaikan dengan varietas perdagangan yang berbeda melalui pengoptimalan parameter. Efektivitas strategi ini dapat ditingkatkan lebih lanjut dengan menambahkan lebih banyak penilaian indikator dan pengoptimalan algoritma pembelajaran mesin.
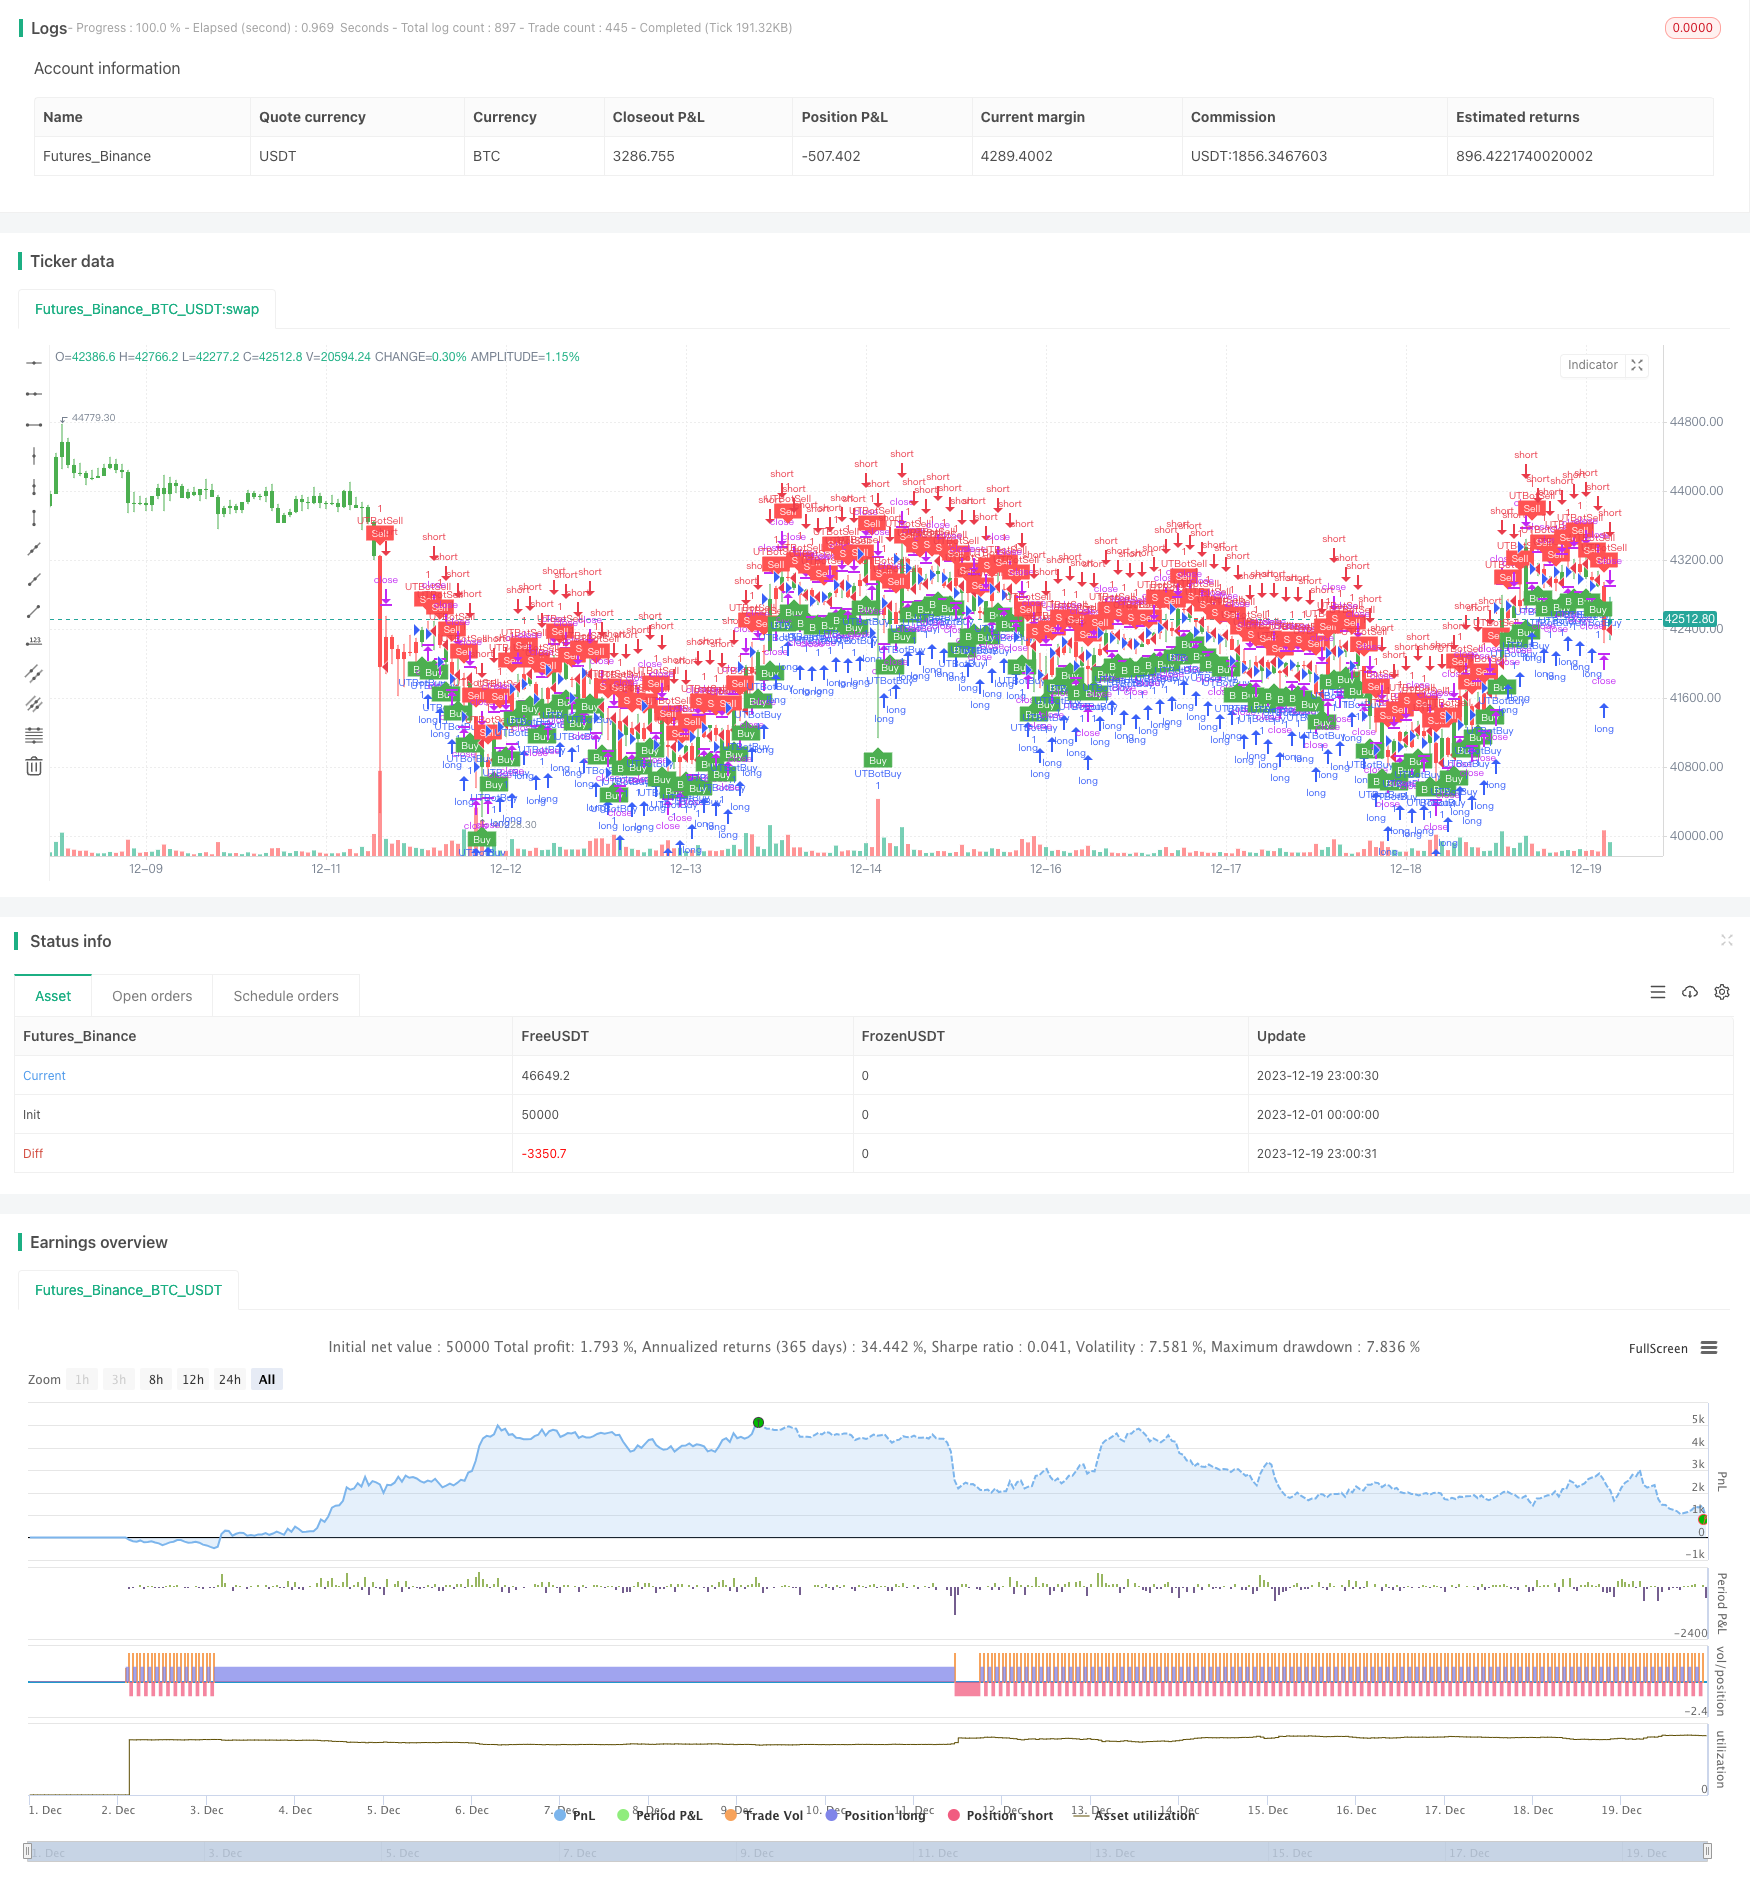
/*backtest
start: 2023-12-01 00:00:00
end: 2023-12-19 23:59:59
period: 1h
basePeriod: 15m
exchanges: [{"eid":"Futures_Binance","currency":"BTC_USDT"}]
*/

//@version=2
strategy(title="UTBot Strategy", overlay = true )

// CREDITS to @HPotter for the orginal code.
// CREDITS to @Yo_adriiiiaan for recently publishing the UT Bot study based on the original code -
// CREDITS to @TradersAITradingPlans for making this Strategy.
// Strategy fixed with Time period by Kirk65.
// I am using this UT bot with 2 hours time frame with god resultss. Alert with "Once per bar" and stoploss 1.5%. If Alerts triggered and price goes against Alert. Stoploss will catch it. Wait until next Alert.
// While @Yo_adriiiiaan mentions it works best on a 4-hour timeframe or above, witch is a lot less risky, but less profitable.

testStartYear = input(2019, "BACKTEST START YEAR", minval = 1980, maxval = 2222)
testStartMonth = input(01, "BACKTEST START MONTH", minval = 1, maxval = 12)
testStartDay = input(01, "BACKTEST START DAY", minval = 1, maxval = 31)
testPeriodStart = timestamp(testStartYear,testStartMonth,testStartDay,0,0)
testStopYear = input(2222, "BACKTEST STOP YEAR", minval=1980, maxval = 2222)
testStopMonth = input(12, "BACKTEST STOP MONTH", minval=1, maxval=12)
testStopDay = input(31, "BACKTEST STOP DAY", minval=1, maxval=31)
testPeriodStop = timestamp(testStopYear, testStopMonth, testStopDay, 0, 0)

testPeriod = true

SOURCE = input(hlc3)
RSILENGTH = input(14, title = "RSI LENGTH")
RSICENTERLINE = input(52, title = "RSI CENTER LINE")
MACDFASTLENGTH = input(7, title = "MACD FAST LENGTH")
MACDSLOWLENGTH = input(12, title = "MACD SLOW LENGTH")
MACDSIGNALSMOOTHING = input(12, title = "MACD SIGNAL SMOOTHING")
a = input(10, title = "Key Vaule. 'This changes the sensitivity'")
SmoothK = input(3)
SmoothD = input(3)
LengthRSI = input(14)
LengthStoch = input(14)
RSISource = input(close)
c = input(10, title="ATR Period")
xATR = atr(c)
nLoss = a * xATR
xATRTrailingStop = iff(close > nz(xATRTrailingStop[1], 0) and close[1] > nz(xATRTrailingStop[1], 0), max(nz(xATRTrailingStop[1]), close - nLoss),
     iff(close < nz(xATRTrailingStop[1], 0) and close[1] < nz(xATRTrailingStop[1], 0), min(nz(xATRTrailingStop[1]), close + nLoss),
     iff(close > nz(xATRTrailingStop[1], 0), close - nLoss, close + nLoss)))
pos =	iff(close[1] < nz(xATRTrailingStop[1], 0) and close > nz(xATRTrailingStop[1], 0), 1,
     iff(close[1] > nz(xATRTrailingStop[1], 0) and close < nz(xATRTrailingStop[1], 0), -1, nz(pos[1], 0)))
color = pos == -1 ? red: pos == 1 ? green : blue
ema= ema(close,1)
above = crossover(ema,xATRTrailingStop )
below = crossover(xATRTrailingStop,ema)
buy = close > xATRTrailingStop and above
sell = close < xATRTrailingStop and below
barbuy = close > xATRTrailingStop
barsell = close < xATRTrailingStop
plotshape(buy, title = "Buy", text = 'Buy', style = shape.labelup, location = location.belowbar, color= green,textcolor = white, transp = 0, size = size.tiny)
plotshape(sell, title = "Sell", text = 'Sell', style = shape.labeldown, location = location.abovebar, color= red,textcolor = white, transp = 0, size = size.tiny)
barcolor(barbuy? green:na)
barcolor(barsell? red:na)
//alertcondition(buy, title='Buy', message='Buy')
//alertcondition(sell, title='Sell', message='Sell')

if (buy)
    strategy.entry("UTBotBuy",strategy.long, when=testPeriod)
if (sell)
    strategy.entry("UTBotSell",strategy.short, when=testPeriod)