Strategi Mengikuti Tren Saluran Harga Rata-rata Bergerak Ganda
Ringkasan
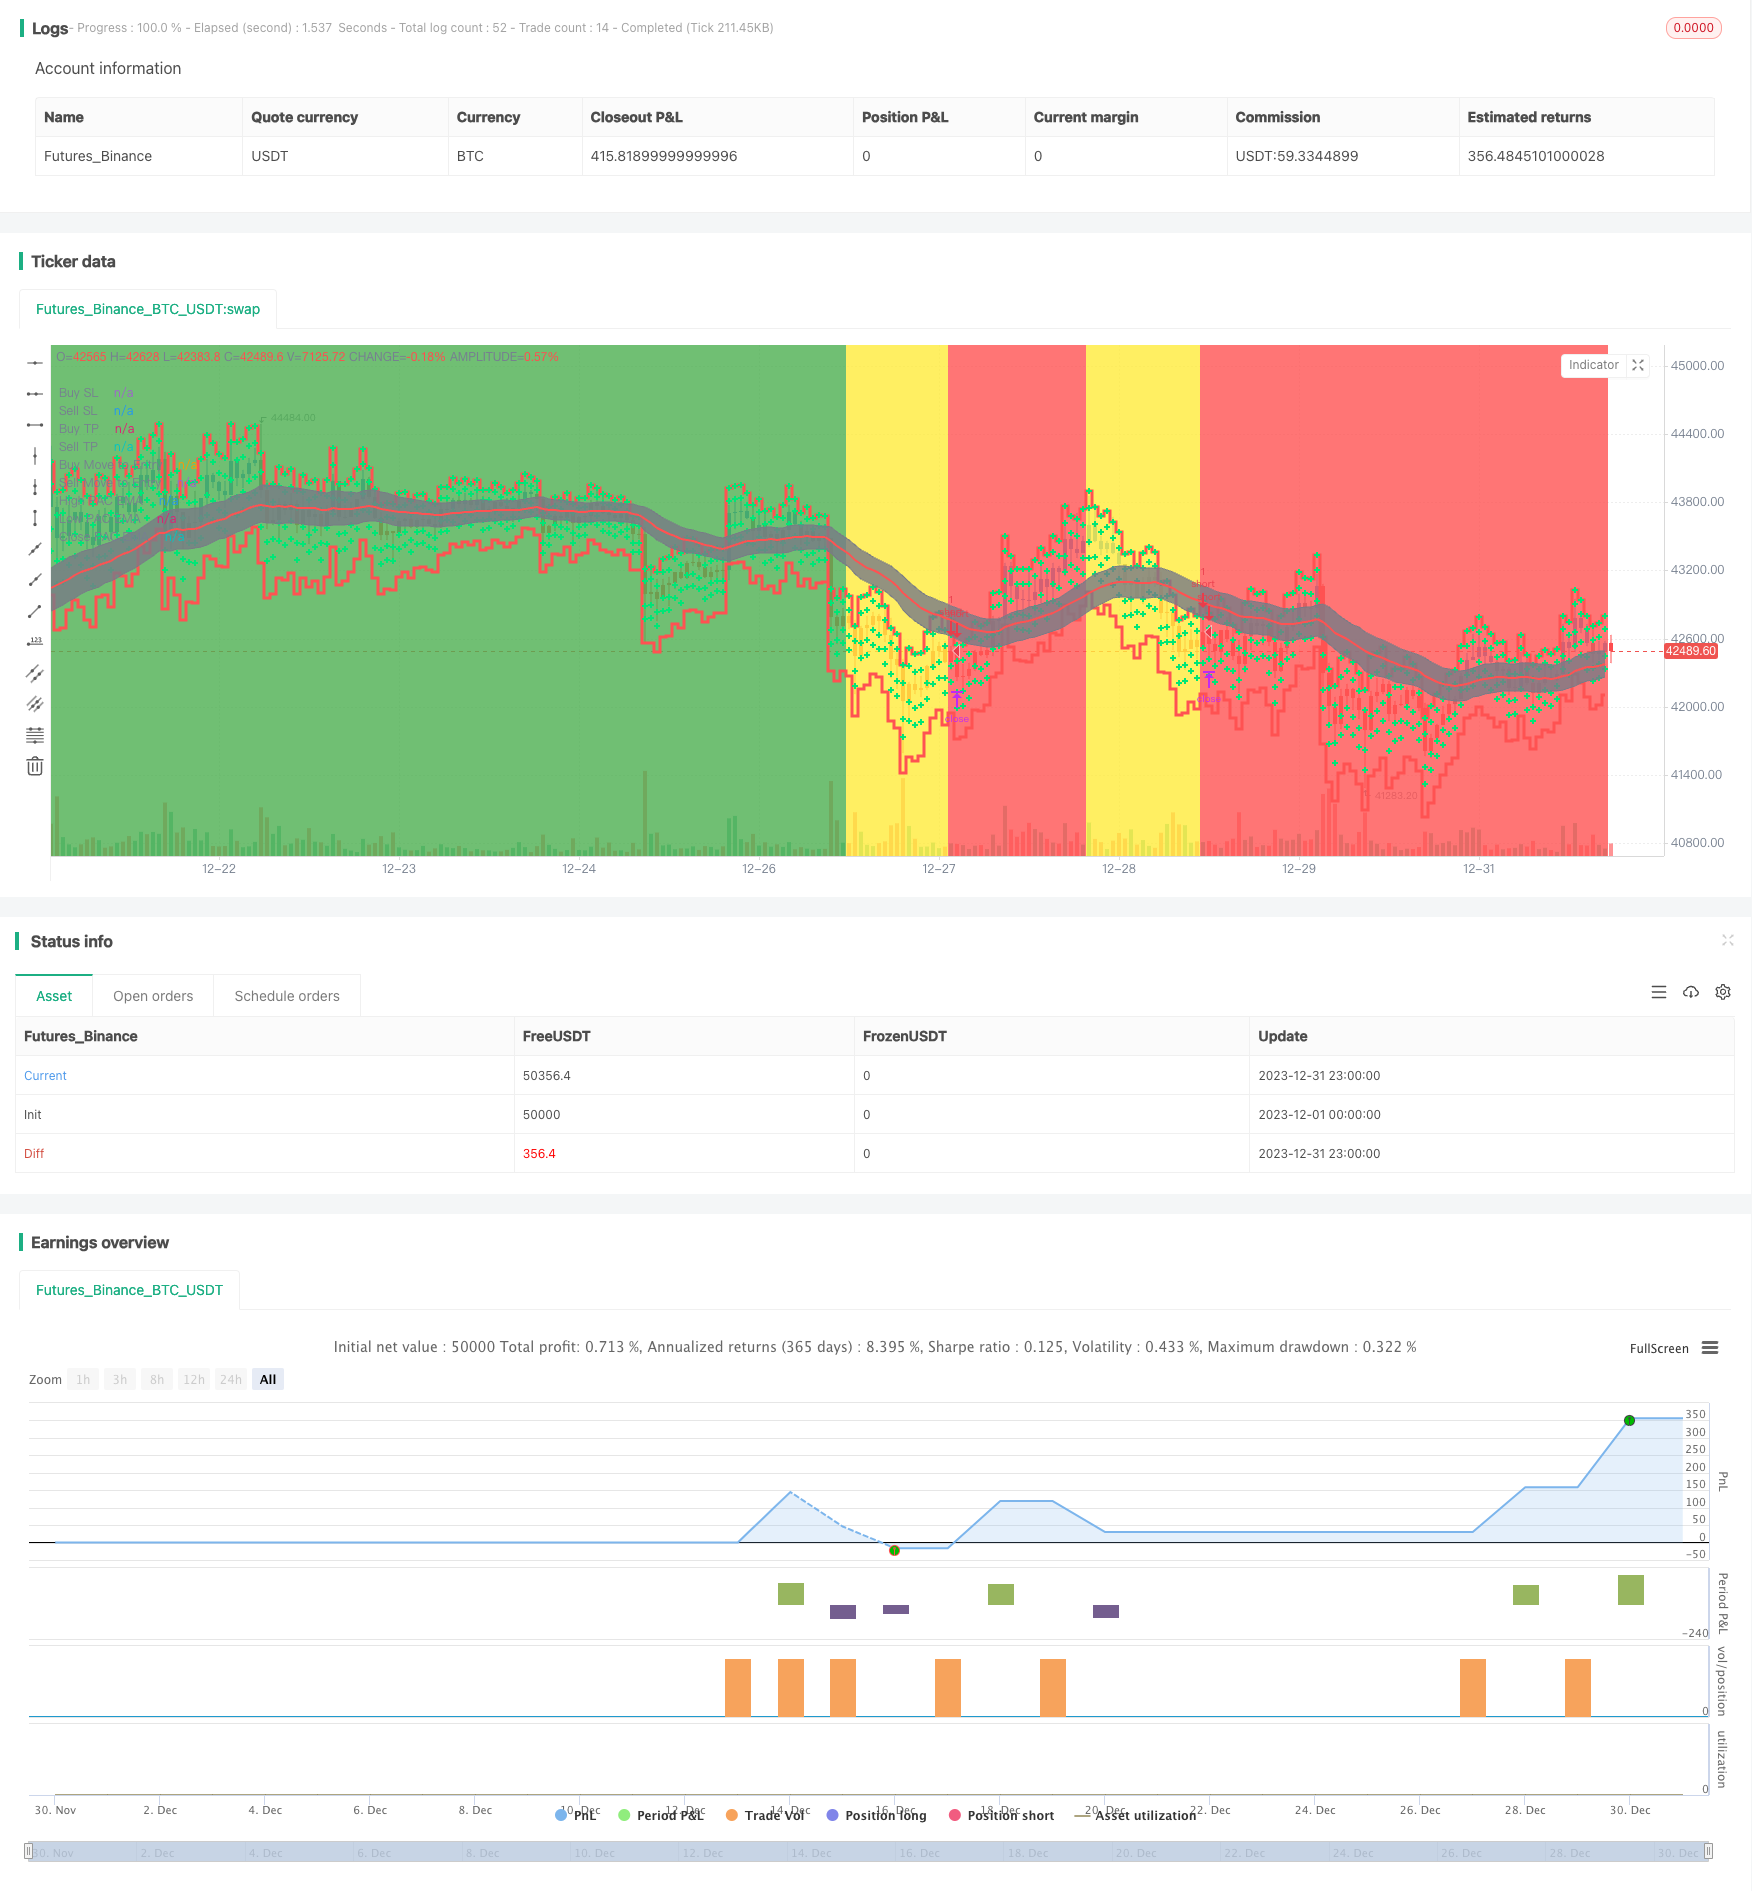
Strategi ini didasarkan pada pembentukan saluran harga dengan dua garis sejajar, menggunakan jangkauan saluran untuk menilai arah tren harga, dan menetapkan strategi pelacakan tren dengan stop loss untuk mengunci keuntungan.
Prinsip Strategi
Strategi saluran harga dua rata menggunakan EMA cepat dan EMA lambat untuk membangun saluran harga. Parameter EMA cepat adalah 89 siklus, parameter EMA lambat adalah 200 siklus.
Ketika EMA cepat berada di atas EMA lambat dan harga di bawah rel, itu dianggap sebagai tren naik; ketika EMA cepat berada di bawah EMA lambat dan harga di atas rel, itu dianggap sebagai tren turun.
Dalam tren naik, strategi akan melakukan shorting saat menentukan trend reversal; dalam tren turun, strategi akan melakukan overtime saat menentukan trend reversal.
Selain itu, strategi ini dilengkapi dengan fitur pelacakan stop loss. Setelah memegang posisi akan diperbarui secara real-time untuk melacak harga stop loss, untuk mengunci keuntungan.
Analisis Keunggulan
Keuntungan terbesar dari strategi ini adalah menggunakan jalur harga untuk menentukan tren harga, kemudian digabungkan dengan reversal order, menghindari mengejar kenaikan dan penurunan. Selain itu, dengan fitur pelacakan stop loss seluler, Anda dapat mengunci keuntungan dan mengurangi risiko kerugian.
Kelebihan lainnya adalah: ruang untuk mengoptimalkan parameter yang besar, parameter dapat disesuaikan untuk varietas dan siklus yang berbeda; pembaruan harga stop loss secara real time, risiko operasi rendah.
Analisis risiko
Risiko utama dari strategi ini adalah bahwa efek dari sinyal pembalikan yang ditentukan tidak baik, dan mungkin terjadi kesalahan penilaian. Pada saat ini perlu mengoptimalkan parameter untuk memastikan bahwa efek dari pembalikan tren ditentukan.
Selain itu, pengaturan stop loss juga sangat penting. Stop loss yang terlalu besar dapat menyebabkan stop loss yang tidak cukup tegas; stop loss yang terlalu kecil dapat menyebabkan stop loss yang berlebihan. Ini perlu disesuaikan dengan varietas tertentu.
Akhirnya, masalah data juga dapat menyebabkan strategi gagal. Pastikan strategi yang digunakan adalah data historis yang dapat diandalkan, konsisten, dan memadai untuk retest dan verifikasi di lapangan.
Arah optimasi
Optimalisasi strategi ini berfokus pada beberapa hal:
Siklus EMA cepat dan EMA lambat dapat dioptimalkan, dengan kombinasi parameter yang berbeda untuk menilai efek
Parameter naik turun dari saluran harga juga dapat disesuaikan untuk mencari parameter siklus yang lebih sesuai
Pengaturan titik stop loss sangat penting untuk menguji parameter yang berbeda untuk mengoptimalkan strategi stop loss
Dapat diuji apakah ada pengantar indikator lain untuk menentukan pembalikan tren, meningkatkan efek tunggal
Meringkaskan
Strategi ini secara keseluruhan beroperasi dengan lancar, menggunakan saluran dua rata-rata untuk menentukan arah tren, dan dengan stop loss bergerak untuk mengunci keuntungan, merupakan strategi pelacakan tren yang lebih stabil. Dengan optimasi parameter dan pengoptimalan pengaturan kontrol angin, strategi ini dapat menjadi salah satu strategi perdagangan kuantitatif yang efisien.
/*backtest
start: 2023-12-01 00:00:00
end: 2023-12-31 23:59:59
period: 1h
basePeriod: 15m
exchanges: [{"eid":"Futures_Binance","currency":"BTC_USDT"}]
*/

//@version=4
strategy("Trend trader Strategy", overlay=true)

//f you want to trade shallower Pullbacks for quicker scalps, try reducing the
//    PAC and EMA combination lengths for example:
//      * 21 PAC and 55, 144, 377 for fast, medium, slow EMAs
//      * 13 PAC and 34, 89, 233 for fast, medium, slow EMAs
//  - Each alert should be evaluated on it's own merits, the alerts are designed to highlight possible
//    scalping trades from Pullback recoveries around the PAC.

fromDay = input(defval = 1, title = "From Day", minval = 1, maxval = 31)
fromMonth = input(defval = 6, title = "From Month", minval = 1, maxval = 12)
fromYear = input(defval = 2020, title = "From Year", minval = 1970)

// To Date Inputs
toDay = input(defval = 1, title = "To Day", minval = 1, maxval = 31)
toMonth = input(defval = 12, title = "To Month", minval = 1, maxval = 12)
toYear = input(defval = 2020, title = "To Year", minval = 1970)

isMon() => dayofweek(time('D')) == dayofweek.monday
isTue() => dayofweek(time('D')) == dayofweek.tuesday
isWed() => dayofweek(time('D')) == dayofweek.wednesday
isThu() => dayofweek(time('D')) == dayofweek.thursday
isFri() => dayofweek(time('D')) == dayofweek.friday

// Calculate start/end date and time condition
DST = 1 //day light saving for usa
//--- Europe
London = iff(DST==0,"0000-0900","0100-1000")
//--- America
NewYork = iff(DST==0,"0400-1400","0500-1500")
//--- Pacific
Sydney = iff(DST==0,"1300-2200","1400-2300")
//--- Asia
Tokyo = iff(DST==0,"1500-2400","1600-0100")

customTime =iff(DST==0,"2300-1500","2400-1600")
customTime2 =iff(DST==0,"0800-1500","0900-1600")

//-- Time In Range
timeinrange(res, sess) => time(res, sess) != 0

london = timeinrange(timeframe.period, London)
newyork = timeinrange(timeframe.period, NewYork)
c_time = timeinrange(timeframe.period,customTime)
c_time2 = timeinrange(timeframe.period,customTime2)

startDate = timestamp(fromYear, fromMonth, fromDay, 00, 00)
finishDate = timestamp(toYear, toMonth, toDay, 00, 00)
time_cond = time >= startDate and time <= finishDate and (london or newyork)


    // === INPUTS ===
HiLoLen         = input(34, minval=2, title="High Low PAC channel Length")
fastEMAlength   = input(89, minval=2)
mediumEMAlength = input(200, minval=2)
slowEMAlength   = input(600, minval=2)
ShowFastEMA     = input(false)
ShowMediumEMA   = input(false)
ShowSlowEMA     = input(false)
ShowHHLL        = input(false)
ShowFractals    = input(false)
filterBW        = input(false, title="Show Ideal Fractals Only")
ShowBarColor    = input(true, title="Show coloured Bars around PAC")
ShowBuySell     = input(false, title="Show Buy/Sell Alert Arrows")
Lookback        = input(3, minval=1, title="Pullback Lookback for PAC Cross Check")
DelayArrow      = input(false, title="Show Alert Arrows Only on Closed Candles")
Delay           = DelayArrow ? 1 : 0
ShowTrendBGcolor= input(true)
UseHAcandles    = input(false, title="Use Heikin Ashi Candles in Algo Calculations")
//
// === /INPUTS ===

// === BASE FUNCTIONS ===

haClose = UseHAcandles ? security(heikinashi(syminfo.tickerid), timeframe.period, close) : close
haOpen  = UseHAcandles ? security(heikinashi(syminfo.tickerid), timeframe.period, open) : open
haHigh  = UseHAcandles ? security(heikinashi(syminfo.tickerid), timeframe.period, high) : high
haLow   = UseHAcandles ? security(heikinashi(syminfo.tickerid), timeframe.period, low) : low


//  ||---   Fractal Recognition Functions:  ---------------------------------------------------------------||
isRegularFractal(mode) =>
    ret = mode == 1 ? high[4] < high[3] and high[3] < high[2] and high[2] > high[1] and
       high[1] > high[0] : mode == -1 ?
       low[4] > low[3] and low[3] > low[2] and low[2] < low[1] and low[1] < low[0] :
       false
    ret

isBWFractal(mode) =>
    ret = mode == 1 ? high[4] < high[2] and high[3] <= high[2] and high[2] >= high[1] and
       high[2] > high[0] : mode == -1 ?
       low[4] > low[2] and low[3] >= low[2] and low[2] <= low[1] and low[2] < low[0] :
       false
    ret
//  ||-----------------------------------------------------------------------------------------------------||

//
// === /BASE FUNCTIONS ===

// === SERIES SETUP ===
//

//  ||---   Setup Moving Averages and PAC channel:
//  ||-----------------------------------------------------------------------------------------------------||
fastEMA     = ema(haClose, fastEMAlength)
mediumEMA   = ema(haClose, mediumEMAlength)
slowEMA     = ema(haClose, slowEMAlength)
pacC        = ema(haClose, HiLoLen)
pacL        = ema(haLow, HiLoLen)
pacU        = ema(haHigh, HiLoLen)
TrendDirection = fastEMA > mediumEMA and pacL > mediumEMA ? 1 :
   fastEMA < mediumEMA and pacU < mediumEMA ? -1 : 0

//  ||---   Fractal Recognition:
//  ||-----------------------------------------------------------------------------------------------------||
filteredtopf = filterBW ? isRegularFractal(1) : isBWFractal(1)
filteredbotf = filterBW ? isRegularFractal(-1) : isBWFractal(-1)
//  ||-----------------------------------------------------------------------------------------------------||
//  ||---   Higher Highs, Lower Highs, Higher Lows, Lower Lows  -------------------------------------------||
valuewhen_H0 = valuewhen(filteredtopf == true, high[2], 0)
valuewhen_H1 = valuewhen(filteredtopf == true, high[2], 1)
valuewhen_H2 = valuewhen(filteredtopf == true, high[2], 2)
//
higherhigh = filteredtopf == false ? false :
   valuewhen_H1 < valuewhen_H0 and valuewhen_H2 < valuewhen_H0
lowerhigh = filteredtopf == false ? false :
   valuewhen_H1 > valuewhen_H0 and valuewhen_H2 > valuewhen_H0
valuewhen_L0 = valuewhen(filteredbotf == true, low[2], 0)
valuewhen_L1 = valuewhen(filteredbotf == true, low[2], 1)
valuewhen_L2 = valuewhen(filteredbotf == true, low[2], 2)
//
higherlow = filteredbotf == false ? false :
   valuewhen_L1 < valuewhen_L0 and valuewhen_L2 < valuewhen_L0
lowerlow = filteredbotf == false ? false :
   valuewhen_L1 > valuewhen_L0 and valuewhen_L2 > valuewhen_L0

//
// === /SERIES ===

//
// === PLOTTING ===
//
// Plot the Price Action Channel (PAC) base on EMA high,low and close
L = plot(pacL, color=color.gray, linewidth=1, title="High PAC EMA", transp=50)
U = plot(pacU, color=color.gray, linewidth=1, title="Low PAC EMA", transp=50)
C = plot(pacC, color=color.red, linewidth=2, title="Close PAC EMA", transp=0)
fill(L, U, color=color.gray, transp=90, title="Fill HiLo PAC")

// Colour bars according to the close position relative to the PAC selected.
BARcolor = haClose > pacU ? color.blue : haClose < pacL ? color.red : color.gray
barcolor(ShowBarColor ? BARcolor : na, title="Bar Colours")
//
BGcolor = TrendDirection == 1 ? color.green :
   TrendDirection == -1 ? color.red : color.yellow
bgcolor(ShowTrendBGcolor ? BGcolor : na, transp=90, title="Trend BG Color")


// STEP 1:
// Configure trail stop level with input options (optional)
longTrailPerc = input(title="Trail Long Loss (%)",
     type=input.float, minval=0.0, step=0.05, defval=0.1) * 0.01

shortTrailPerc = input(title="Trail Short Loss (%)",
     type=input.float, minval=0.0, step=0.05, defval=0.1) * 0.01


atrRange = input(14, title="ATR Range", type=input.integer)
buyStop = input(2, title="* ATR Buy SL", type=input.float)
sellStop = input(1, title="* ATR Sell SL", type=input.float)
targetATR = input(1, title="* ATR TP1", type=input.float)
moveToEntryFigure = input(0.5, title=" move to entry in % towards target", type=input.float)

showMove = input(true, title="Show Move to Entry points")

showMoveBuycol = showMove ? color.lime : na
showMoveSellcol = showMove ? color.lime : na

// Plots

buyStopp = plot(close - atr(atrRange) * buyStop, title="Buy SL", style=plot.style_stepline, color=color.red, transp=75, linewidth=3)
sellStopp = plot(close + atr(atrRange) * sellStop, title="Sell SL", style=plot.style_stepline, color=color.red, transp=75, linewidth=3)

buyTP1 = plot(close + atr(atrRange) * targetATR, title="Buy TP", style=plot.style_cross, color=color.lime, transp=75, linewidth=3)
sellTP1 = plot(close - atr(atrRange) * targetATR, title="Sell TP", style=plot.style_cross, color=color.lime, transp=75, linewidth=3)

buyMove = plot(close + atr(atrRange) * targetATR * moveToEntryFigure, title="Buy Move to Entry", style=plot.style_cross, color=showMoveBuycol, transp=75, linewidth=3)
sellMove = plot(close - atr(atrRange) * targetATR * moveToEntryFigure, title="Sell Move to Entry", style=plot.style_cross, color=showMoveSellcol, transp=75, linewidth=3)


if barstate.isconfirmed
    if(BGcolor==color.red and BGcolor[1]==color.yellow and c_time )
        strategy.entry("short", strategy.short, comment="short", alert_message='short')
        strategy.cancel("long")
    if(BGcolor==color.green and BGcolor[1]==color.yellow and c_time )
        strategy.entry("long", strategy.long, comment="long", alert_message = 'long')
        strategy.cancel("short")


// STEP 2:
// Determine trail stop loss prices
longStopPrice = 0.0, shortStopPrice = 0.0

longStopPrice := if (strategy.position_size > 0)
    stopValue = close * (1 - longTrailPerc)
    max(stopValue, longStopPrice[1])
else
    0

shortStopPrice := if (strategy.position_size < 0)
    stopValue = close * (1 + shortTrailPerc)
    min(stopValue, shortStopPrice[1])
else
    999999

// Plot stop loss values for confirmation
plot(series=(strategy.position_size > 0) ? longStopPrice : na,
     color=color.fuchsia, style=plot.style_cross,
     linewidth=2, title="Long Trail Stop")
plot(series=(strategy.position_size < 0) ? shortStopPrice : na,
     color=color.fuchsia, style=plot.style_cross,
     linewidth=2, title="Short Trail Stop")


// STEP 3:
// Submit exit orders for trail stop loss price
//if (strategy.position_size > 0)
//    strategy.exit("XL TRL STP","long", stop=longStopPrice)

//if (strategy.position_size < 0)
//    strategy.exit("XS TRL STP","short", stop=shortStopPrice)


tp=input(0.0032,type=input.float, title="tp")
sl=input(0.001,type=input.float, title="sl")

//strategy.close("long", when= tp/2,qty_percent = 50)

//strategy.exit("longtp/sl","long",profit=tp, loss=sl, stop=longStopPrice, alert_message='closelong')
//strategy.exit("shorttp/sl","short",profit=tp, loss=sl, stop=shortStopPrice, alert_message='closeshort')

//tpatrlong= close + atr(atrRange) * targetATR
//slatrlong= close - atr(atrRange) * buyStop

//strategy.exit("longtp/sl","long",profit=tp, loss=sl, alert_message='closelong')
//strategy.exit("shorttp/sl","short",profit=tp, loss=sl, alert_message='closeshort')

strategy.exit("closelong", "long" , profit = close * tp / syminfo.mintick, loss = close * sl / syminfo.mintick, alert_message = "closelong")
strategy.exit("closeshort", "short" , profit = close * tp / syminfo.mintick, loss = close * sl / syminfo.mintick, alert_message = "closeshort")

if(BGcolor==color.yellow or not c_time)
    strategy.close("short", comment="time or yellow", alert_message='closeshort')
    strategy.close("long", comment="time or yellow", alert_message='closelong')