
スーパーダイナミクス戦略は,複数のダイナミクス指標を総合的に使用し,複数のダイナミクス指標が同時に上昇または低下しているときに,買入または販売を行う.この戦略は,複数のダイナミクス指標を組み合わせることで,価格の傾向をより正確に捉え,単一の指標による誤った信号を避けることができます.
この戦略は4つのEvergetのRMI指標と1つのChandeの動力振動指標を同時に使用している.RMI指標は価格動力の計算に基づいて,価格の上昇と下落の強さを判断することができる.Chande MOは価格の変化を計算して,市場の過剰買いと過剰販売を判断することができる.
RMI5で買入ラインを穿い,RMI4で買入ラインを穿い,RMI3で買入ラインを穿い,RMI2で買入ラインを穿い,RMI1で買入ラインを穿い,Chande MOで買入ラインを穿い,買入操作を行う.
RMI5の下のセールスライン,RMI4の下のセールスライン,RMI3の下のセールスライン,RMI2の下のセールスライン,RMI1の下のセールスライン,Chande MOの下のセールスラインを通るとき,セールス操作を行う.
RMI5は,他のRMI指標とは逆の方向に設定され,これはトレンドをよりよく認識し,ピラミッド操作を行うことができます.
複数の指標を統合することで,トレンドを正確に判断し,単一の指標の誤信号を避ける
複数のタイムサイクルを含む指標で,より大きなレベルのトレンドを識別できます.
リバースRMI指標は,トレンド識別とピラミッド操作を補助します.
チャンデ・MOは,過買過売の誤った取引を防ぐのに役立ちます.
指標の組み合わせが多すぎ,パラメータの設定が複雑で,慎重にテストして最適化する必要がある
複数の指標が同時に変化すると,誤信号が生じる可能性があります.
複数の指標を合わせると,取引頻度は比較的低い可能性があります.
種と市場環境に適した指標のパラメータに注目する
テスト指標パラメータの設定,戦略の安定性を高めるためにパラメータを最適化
信号の質への影響を評価するために,いくつかの指標を増加または減少させようとします.
特定の市場の状況で誤った信号を避けるために,いくつかのフィルタリング条件を導入できます.
インジケーターの買出ラインの位置を調整し,最適のパラメータの組み合わせを見つける
リスク管理の為の減損策の導入を検討
この戦略は,複数の動態指標を総合的に使用することにより,市場動向の判断能力を向上させる.しかし,パラメータの設定は複雑で,慎重にテストして最適化,継続的に改善し,調整する必要がある.正しく使用すると,優れた取引信号を得ることを期待し,市場動向を追跡する点で一定の優位性を持っています.しかし,トレーダーは依然としてリスクに注意し,最適なパラメータの組み合わせを探し,リスク制御機構に加入して安定した取引を行う必要があります.
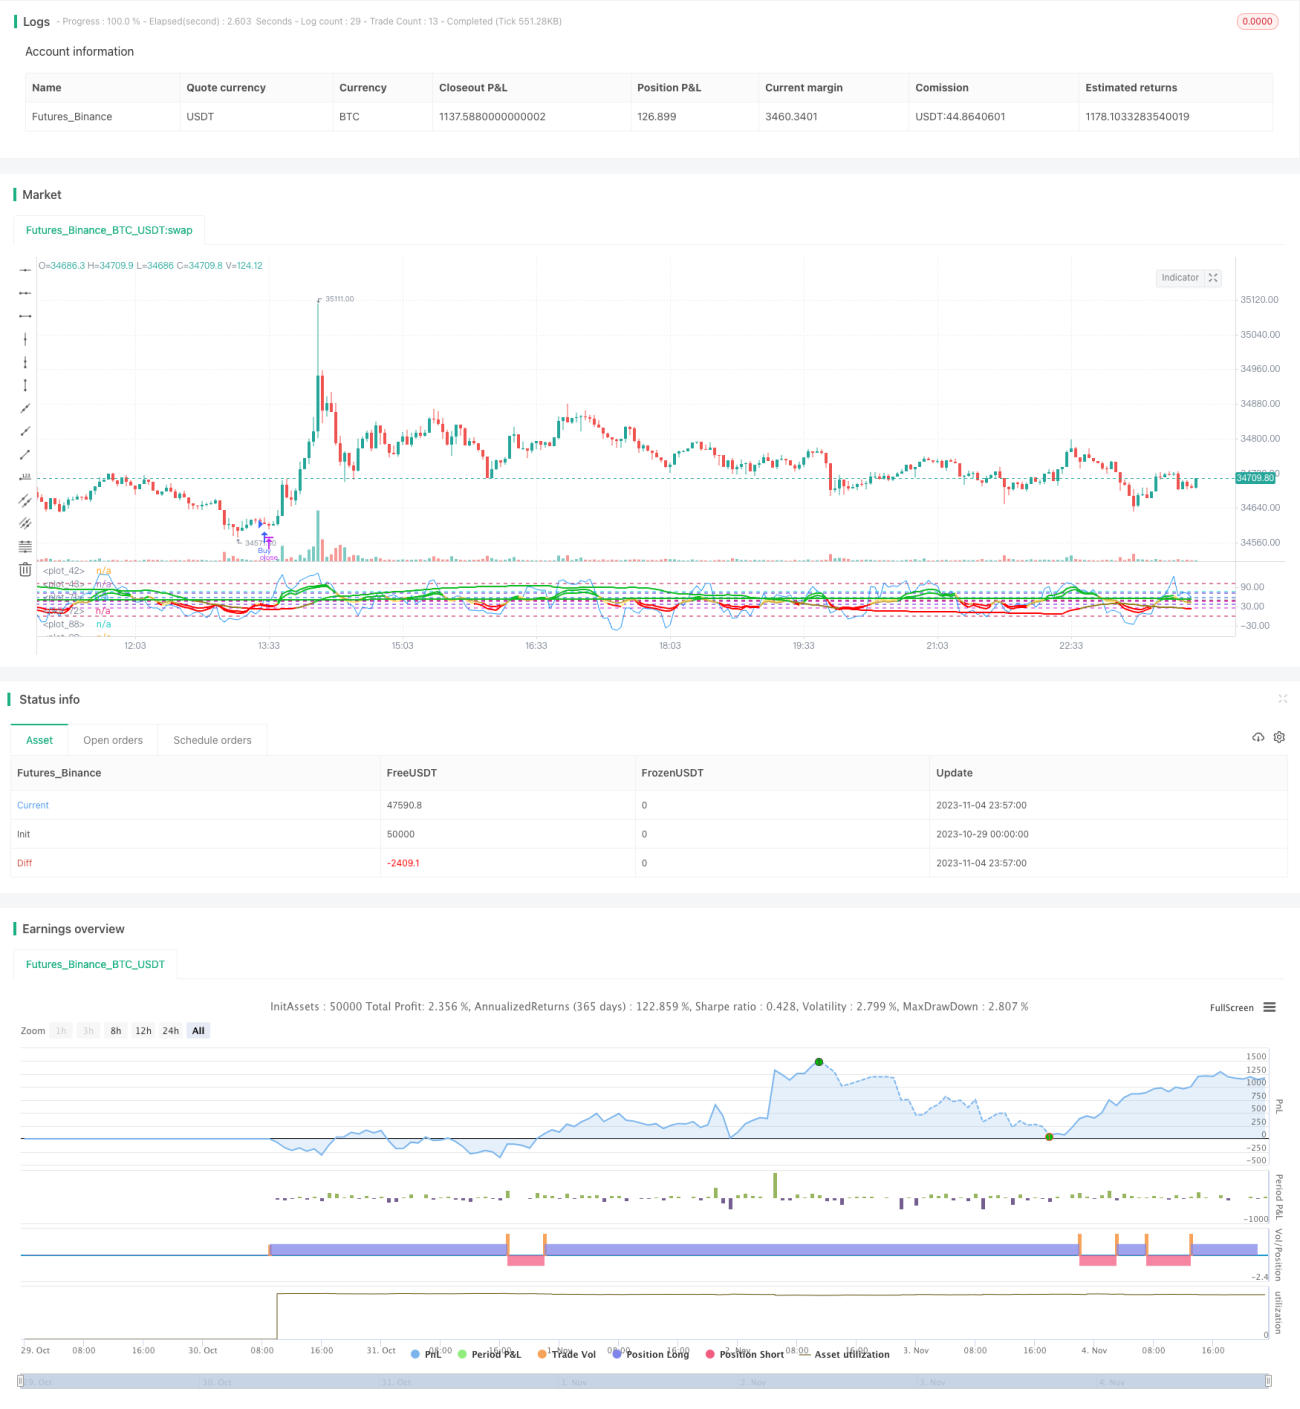
/*backtest
start: 2023-10-29 00:00:00
end: 2023-11-05 00:00:00
period: 3m
basePeriod: 1m
exchanges: [{"eid":"Futures_Binance","currency":"BTC_USDT"}]
*/
//@version=4
strategy(title="Super Momentum Strat", shorttitle="SMS", format=format.price, precision=2)
//* Backtesting Period Selector | Component *//
//* https://www.tradingview.com/script/eCC1cvxQ-Backtesting-Period-Selector-Component *//
//* https://www.tradingview.com/u/pbergden/ *//
//* Modifications made *//
testStartYear = input(2021, "Backtest Start Year")
testStartMonth = input(1, "Backtest Start Month")
testStartDay = input(1, "Backtest Start Day")
testPeriodStart = timestamp(testStartYear,testStartMonth,testStartDay,0,0)
testStopYear = input(999999, "Backtest Stop Year")
testStopMonth = input(9, "Backtest Stop Month")
testStopDay = input(26, "Backtest Stop Day")
testPeriodStop = timestamp(testStopYear,testStopMonth,testStopDay,0,0)
testPeriod() => true
/////////////// END - Backtesting Period Selector | Component ///////////////
src = input(close, "Price", type = input.source)
highlightBreakouts = input(title="Highlight Overbought/Oversold Breakouts ?", type=input.bool, defval=true)
CMOlength = input(9, minval=1, title="Alpha Chande Momentum Length")
//CMO
momm = change(src)
f1(m) => m >= 0.0 ? m : 0.0
f2(m) => m >= 0.0 ? 0.0 : -m
m1 = f1(momm)
m2 = f2(momm)
sm1 = sum(m1, CMOlength)
sm2 = sum(m2, CMOlength)
percent(nom, div) => 100 * nom / div
chandeMO = percent(sm1-sm2, sm1+sm2)+50
plot(chandeMO, "Chande MO", color=color.blue)
obLevel = input(75, title="Chande Sellline")
osLevel = input(25, title="Chande Buyline")
hline(obLevel, color=#0bc4d9)
hline(osLevel, color=#0bc4d9)
///
///RMIS
//
// Copyright (c) 2018-present, Alex Orekhov (everget)
// Relative Momentum Index script may be freely distributed under the MIT license.
//
///
///
//RMI1
length1 = input(title="RMI1 Length", type=input.integer, minval=1, defval=8)
momentumLength1 = input(title="RMI1 Momentum ", type=input.integer, minval=1, defval=3)
up1 = rma(max(change(src, momentumLength1), 0), length1)
down1 = rma(-min(change(src, momentumLength1), 0), length1)
rmi1 = down1 == 0 ? 100 : up1 == 0 ? 0 : 100 - (100 / (1 + up1 / down1))
obLevel1 = input(57, title="RMI1 Sellline")
osLevel1 = input(37, title="RMI1 Buyline")
rmiColor1 = rmi1 > obLevel1 ? #0ebb23 : rmi1 < osLevel1 ? #ff0000 : #ffe173
plot(rmi1, title="RMI 1", linewidth=2, color=rmiColor1, transp=0)
hline(obLevel1, color=#0b57d9)
hline(osLevel1, color=#0b57d9)
//RMI2
length2 = input(title="RMI2 Length", type=input.integer, minval=1, defval=12)
momentumLength2 = input(title="RMI2 Momentum ", type=input.integer, minval=1, defval=3)
up2 = rma(max(change(src, momentumLength1), 0), length2)
down2 = rma(-min(change(src, momentumLength1), 0), length2)
rmi2 = down2 == 0 ? 100 : up1 == 0 ? 0 : 100 - (100 / (1 + up2 / down2))
obLevel2 = input(72, title="RMI2 Sellline")
osLevel2 = input(37, title="RMI2 Buyline")
rmiColor2 = rmi1 > obLevel1 ? #0ebb23 : rmi2 < osLevel2 ? #ff0000 : #c9ad47
plot(rmi2, title="RMI 2", linewidth=2, color=rmiColor2, transp=0)
hline(obLevel2, color=#5a0bd9)
hline(osLevel2, color=#5a0bd9)
//RMI3
length3 = input(title="RMI3 Length", type=input.integer, minval=1, defval=30)
momentumLength3 = input(title="RMI3 Momentum ", type=input.integer, minval=1, defval=53)
up3 = rma(max(change(src, momentumLength3), 0), length3)
down3 = rma(-min(change(src, momentumLength3), 0), length3)
rmi3 = down3 == 0 ? 100 : up3 == 0 ? 0 : 100 - (100 / (1 + up3 / down3))
obLevel3 = input(46, title="RMI3 Sellline")
osLevel3 = input(24, title="RMI3 Buyline")
rmiColor3 = rmi3 > obLevel3 ? #0ebb23 : rmi3 < osLevel3 ? #ff0000 : #967d20
plot(rmi3, title="RMI 3", linewidth=2, color=rmiColor3, transp=0)
hline(obLevel3, color=#cf0bd9)
hline(osLevel3, color=#cf0bd9)
//RMI4
length4 = input(title="RMI4 Length", type=input.integer, minval=1, defval=520)
momentumLength4 = input(title="RMI4 Momentum ", type=input.integer, minval=1, defval=137)
up4 = rma(max(change(src, momentumLength4), 0), length4)
down4 = rma(-min(change(src, momentumLength4), 0), length4)
rmi4 = down4 == 0 ? 100 : up4 == 0 ? 0 : 100 - (100 / (1 + up4 / down4))
obLevel4 = input(0, title="RMI4 Sellline")
osLevel4 = input(100, title="RMI4 Buyline")
rmiColor4 = rmi4 > obLevel4 ? #0ebb23 : rmi4 < osLevel4 ? #ff0000 : #7a630b
plot(rmi4, title="RMI 4", linewidth=2, color=rmiColor4, transp=0)
hline(obLevel4, color=#bd1150)
hline(osLevel4, color=#bd1150)
//RMI5
length5 = input(title="RMI5 Length", type=input.integer, minval=1, defval=520)
momentumLength5 = input(title="RMI5 Momentum ", type=input.integer, minval=1, defval=137)
up5 = rma(max(change(src, momentumLength5), 0), length5)
down5 = rma(-min(change(src, momentumLength5), 0), length5)
rmi5 = down5 == 0 ? 100 : up4 == 0 ? 0 : 100 - (100 / (1 + up5 / down5))
buy5 = input(0, title="RMI5 Buy Above")
sell5 = input(47, title="RMI5 Sell Below")
rmiColor5 = rmi5 > buy5 ? #0ebb23 : rmi5 < sell5 ? #ff0000 : #7a630b
plot(rmi5, title="RMI 5", linewidth=2, color=rmiColor5, transp=0)
hline(buy5, color=#bd1150)
hline(sell5, color=#bd1150)
///
///END RMIS
//
//
// Relative Momentum Index script may be freely distributed under the MIT license.
//
///
///
hline(50, color=#C0C0C0, linestyle=hline.style_dashed, title="Zero Line")
//alerts
longcondition1 = crossover(chandeMO, osLevel)
shortcondition1 = crossunder(chandeMO, obLevel)
longcondition2 = rmi5>buy5 and rmi4<osLevel4 and rmi3<osLevel3 and rmi2<osLevel2 and rmi1<osLevel1 and longcondition1
shortcondition2 = rmi5<sell5 and rmi4>obLevel4 and rmi3>obLevel3 and rmi2>obLevel2 and rmi1>obLevel1 and shortcondition1
if testPeriod()
if longcondition2
strategy.entry("Buy", strategy.long)
if shortcondition2
strategy.entry("Sell", strategy.short)