モメンタムブレイクアウトトレンドフォロー戦略


作成日: 2023-11-06 09:37:44 最終変更日: 2023-11-06 09:56:20
コピー: 0 クリック数: 698
1
フォロー
1617
フォロワー

モメンタムブレイクアウトトレンドフォロー戦略

概要

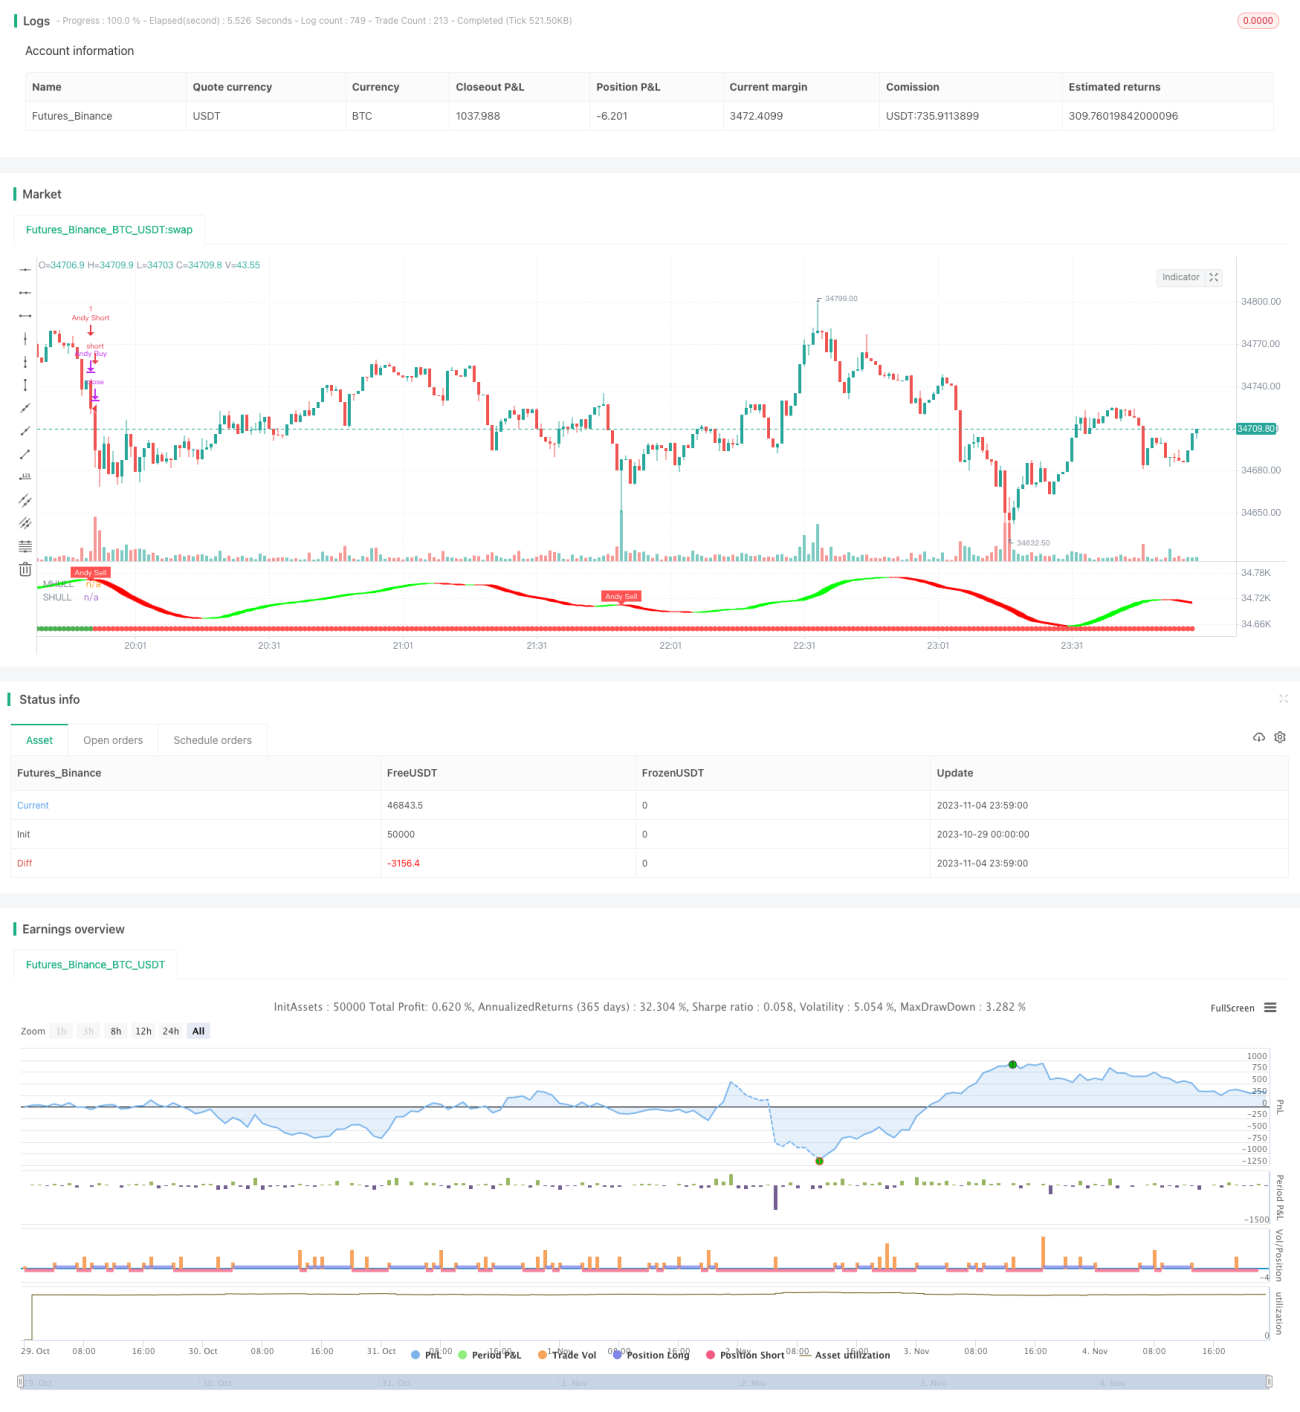
この戦略は,トレンドの方向性を識別する複数の技術指標を統合して使用し,トレンドが動力を突破すると追跡し,余分な利益を得ることを追求します.

戦略原則

  1. ドンチアンチャネルを使用して,全体的なトレンドの方向を判断します. 価格がチャネルを突破すると,トレンドの転換が確認されます.

  2. ハル移動平均はトレンドの方向を判断するのに役立ちます.この指標は価格の変化に敏感であり,トレンドの転換を事前に発見できます.

  3. 半軌道系は,買入と売却の信号を発する.このシステムは,価格チャネルと平均の実際の波動範囲に基づいて,偽の突破を回避する.

  4. ドンキアン通路,ハル指標,半軌道システムが同時に信号を発したときに,トレンドが有力な動力突破を発生したと判断し,この時点でフィールドに入ります.

  5. 平仓条件:上記の指標が逆転信号を発したときに,トレンドの逆転を判定し,直ちに止損退出する.

優位分析

  • 多指標組合せで判断力が高い。Donchian通路は基本を判定し,Hull指標と半軌道は詳細を判定し,トレンドの正確な転換点を把握する。

  • 動力突破参加,余剰利益を追求する。トレンドが強烈に突破する時にのみ入場し,震動中に巻き込まれるのを避ける。

  • 厳格な止損は,資金の安全を保証する.指標が逆転信号を発信すると,すぐに止損し,損失の拡大を避ける.

  • パラメータ調整は柔軟で,様々な市場に対応する.チャネル長さ,波動区間などのパラメータを調整し,異なる周期に対して最適化することができる.

  • 簡単に理解し,実装し,初心者でも習得できる.指標と条件の組み合わせはシンプルでわかりやすく,プログラムしやすい.

リスク分析

  • トレンドの初期にチャンスを逃した. 遅いタイミングで入って,初期上昇は捕まえられない.

  • 突破失敗は損失を還元する.入場後に突破失敗と逆転が起こり,損失が生じます.

  • 指標は誤り信号を発する.パラメータが正しく設定されていないため,指標判断に誤りが生じることがあります.

  • 取引回数限定 明確なトレンドの突破時にのみ入場し,年間取引回数限定 ◎

最適化の方向

  • パラメータの組み合わせを最適化する.異なるパラメータをテストして最適な組み合わせを見つける.

  • ストップ・ローズ・リトラクションの条件を追加する. ストップ・ローズを早め,トレンドの機会を逃さないようにする.

  • 他の指標のフィルタを追加する.MACD,KDJなどの補助判断,誤信号を減らす.

  • 取引時間帯を最適化する.異なる時間帯のパラメータを最適化することができる.

  • 資金利用の効率を拡大する. 杆,固定投資などの方法によって資金利用の効率を向上させる.

要約する

この戦略は,動力の突破が起こるタイミングを判断する複数の指標を統合し,形成されたトレンドを追跡することにより,余剰収益を達成する. 厳格な止損機構は,リスクを制御し,柔軟なパラメータ調整は,異なる市場環境に適応する. 取引頻度は低いが,各取引は,高いリターンを得ることを目指す. パラメータ最適化,補助指標の導入などの方法によって,この戦略は,継続的に改善することができる.

ストラテジーソースコード
/*backtest
start: 2023-10-29 00:00:00
end: 2023-11-05 00:00:00
period: 1m
basePeriod: 1m
exchanges: [{"eid":"Futures_Binance","currency":"BTC_USDT"}]
*/

// This source code is subject to the terms of the Mozilla Public License 2.0 at https://mozilla.org/MPL/2.0/
// © kgynofomo

// @version=5
strategy(title="[Salavi] | Andy Super Pro Strategy",overlay = true)

//Doinchian Trend Ribbon
dlen = input.int(defval=30, minval=10)

dchannel(len) =>
    float hh = ta.highest(len)
    float ll = ta.lowest(len)

    int trend = 0
    trend := close > hh[1] ? 1 : close < ll[1] ? -1 : nz(trend[1])
    trend

dchannelalt(len, maintrend) =>
    float hh = ta.highest(len)
    float ll = ta.lowest(len)

    int trend = 0
    trend := close > hh[1] ? 1 : close < ll[1] ? -1 : nz(trend[1])
    maintrend == 1 ? trend == 1 ? #00FF00ff : #00FF009f : maintrend == -1 ? trend == -1 ? #FF0000ff : #FF00009f : na

maintrend = dchannel(dlen)
donchian_bull = maintrend==1
donchian_bear = maintrend==-1


//Hulls
src = input(hlc3, title='Source')
modeSwitch = input.string('Hma', title='Hull Variation', options=['Hma', 'Thma', 'Ehma'])
length = input(55, title='Length')
lengthMult = input(1.0, title='Length multiplier ')

useHtf = false
htf = '240'

switchColor = true
candleCol = false
visualSwitch = true
thicknesSwitch = 1
transpSwitch = 40

//FUNCTIONS
//HMA
HMA(_src, _length) =>
    ta.wma(2 * ta.wma(_src, _length / 2) - ta.wma(_src, _length), math.round(math.sqrt(_length)))
//EHMA    
EHMA(_src, _length) =>
    ta.ema(2 * ta.ema(_src, _length / 2) - ta.ema(_src, _length), math.round(math.sqrt(_length)))
//THMA    
THMA(_src, _length) =>
    ta.wma(ta.wma(_src, _length / 3) * 3 - ta.wma(_src, _length / 2) - ta.wma(_src, _length), _length)

//SWITCH
Mode(modeSwitch, src, len) =>
    modeSwitch == 'Hma' ? HMA(src, len) : modeSwitch == 'Ehma' ? EHMA(src, len) : modeSwitch == 'Thma' ? THMA(src, len / 2) : na

//OUT
_hull = Mode(modeSwitch, src, int(length * lengthMult))
HULL = useHtf ? request.security(syminfo.ticker, htf, _hull) : _hull
MHULL = HULL[0]
SHULL = HULL[2]

//COLOR
hullColor = switchColor ? HULL > HULL[2] ? #00ff00 : #ff0000 : #ff9800
hull_bull = HULL > HULL[2]
bull_start = hull_bull and hull_bull[1]==false
hull_bear = HULL < HULL[2]
bear_start = hull_bear and hull_bear[1]==false

barcolor(color=candleCol ? switchColor ? hullColor : na : na)

//halftrend
amplitude = input(title='Amplitude', defval=2)
channelDeviation = input(title='Channel Deviation', defval=2)
// showArrows = input(title='Show Arrows', defval=true)
// showChannels = input(title='Show Channels', defval=true)

var int trend = 0
var int nextTrend = 0
var float maxLowPrice = nz(low[1], low)
var float minHighPrice = nz(high[1], high)

var float up = 0.0
var float down = 0.0
float atrHigh = 0.0
float atrLow = 0.0
float arrowUp = na
float arrowDown = na

atr2 = ta.atr(100) / 2
dev = channelDeviation * atr2

highPrice = high[math.abs(ta.highestbars(amplitude))]
lowPrice = low[math.abs(ta.lowestbars(amplitude))]
highma = ta.sma(high, amplitude)
lowma = ta.sma(low, amplitude)

if nextTrend == 1
    maxLowPrice := math.max(lowPrice, maxLowPrice)

    if highma < maxLowPrice and close < nz(low[1], low)
        trend := 1
        nextTrend := 0
        minHighPrice := highPrice
        minHighPrice
else
    minHighPrice := math.min(highPrice, minHighPrice)

    if lowma > minHighPrice and close > nz(high[1], high)
        trend := 0
        nextTrend := 1
        maxLowPrice := lowPrice
        maxLowPrice

if trend == 0
    if not na(trend[1]) and trend[1] != 0
        up := na(down[1]) ? down : down[1]
        arrowUp := up - atr2
        arrowUp
    else
        up := na(up[1]) ? maxLowPrice : math.max(maxLowPrice, up[1])
        up
    atrHigh := up + dev
    atrLow := up - dev
    atrLow
else
    if not na(trend[1]) and trend[1] != 1
        down := na(up[1]) ? up : up[1]
        arrowDown := down + atr2
        arrowDown
    else
        down := na(down[1]) ? minHighPrice : math.min(minHighPrice, down[1])
        down
    atrHigh := down + dev
    atrLow := down - dev
    atrLow

ht = trend == 0 ? up : down

var color buyColor = color.blue
var color sellColor = color.red

htColor = trend == 0 ? buyColor : sellColor
// htPlot = plot(ht, title='HalfTrend', linewidth=2, color=htColor)

// atrHighPlot = plot(showChannels ? atrHigh : na, title='ATR High', style=plot.style_circles, color=color.new(sellColor, 0))
// atrLowPlot = plot(showChannels ? atrLow : na, title='ATR Low', style=plot.style_circles, color=color.new(buyColor, 0))

// fill(htPlot, atrHighPlot, title='ATR High Ribbon', color=color.new(sellColor, 90))
// fill(htPlot, atrLowPlot, title='ATR Low Ribbon', color=color.new(buyColor, 90))

HalfTrend_buySignal = not na(arrowUp) and trend == 0 and trend[1] == 1
HalfTrend_sellSignal = not na(arrowDown) and trend == 1 and trend[1] == 0

// plotshape(showArrows and buySignal ? atrLow : na, title='Arrow Up', style=shape.triangleup, location=location.absolute, size=size.tiny, color=color.new(buyColor, 0))
// plotshape(showArrows and sellSignal ? atrHigh : na, title='Arrow Down', style=shape.triangledown, location=location.absolute, size=size.tiny, color=color.new(sellColor, 0))


//ema
filter_ema = ta.ema(close,200)
ema_bull = close>filter_ema
ema_bear = close<filter_ema

atr_length = input.int(7)
atr = ta.atr(atr_length)
atr_rsi_length = input.int(50)
atr_rsi = ta.rsi(atr,atr_rsi_length)
atr_valid = atr_rsi>50

longCondition = bull_start and atr_valid
shortCondition = bear_start and atr_valid

Exit_long_condition = shortCondition
Exit_short_condition = longCondition

if longCondition
    strategy.entry("Andy Buy",strategy.long, limit=close,comment="Andy Buy Here")

if Exit_long_condition
    strategy.close("Andy Buy",comment="Andy Buy Out")
    // strategy.entry("Andy fandan Short",strategy.short, limit=close,comment="Andy 翻單 short Here")
    // strategy.close("Andy fandan Buy",comment="Andy short Out")


if shortCondition
    strategy.entry("Andy Short",strategy.short, limit=close,comment="Andy short Here")


// strategy.exit("STR","Long",stop=longstoploss)
if Exit_short_condition
    strategy.close("Andy Short",comment="Andy short Out")
    // strategy.entry("Andy fandan Buy",strategy.long, limit=close,comment="Andy 翻單 Buy Here")
    // strategy.close("Andy fandan Short",comment="Andy Buy Out")


inLongTrade = strategy.position_size > 0
inLongTradecolor = #58D68D
notInTrade = strategy.position_size == 0
inShortTrade = strategy.position_size < 0

// bgcolor(color = inLongTrade?color.rgb(76, 175, 79, 70):inShortTrade?color.rgb(255, 82, 82, 70):na)
plotshape(close!=0,location = location.bottom,color = inLongTrade?color.green:inShortTrade?color.red:na)


plotshape(longCondition, title='Buy', text='Andy Buy', style=shape.labelup, location=location.belowbar, color=color.new(color.green, 0), textcolor=color.new(color.white, 0), size=size.tiny)
plotshape(shortCondition, title='Sell', text='Andy Sell', style=shape.labeldown, location=location.abovebar, color=color.new(color.red, 0), textcolor=color.new(color.white, 0), size=size.tiny)

Fi1 = plot(MHULL, title='MHULL', color=hullColor, linewidth=thicknesSwitch, transp=50)
Fi2 = plot(SHULL, title='SHULL', color=hullColor, linewidth=thicknesSwitch, transp=50)

fill(Fi1, Fi2, title='Band Filler', color=hullColor, transp=transpSwitch)