三本の移動平均線クロスオーバー戦略

1
Follow
1796
Followers
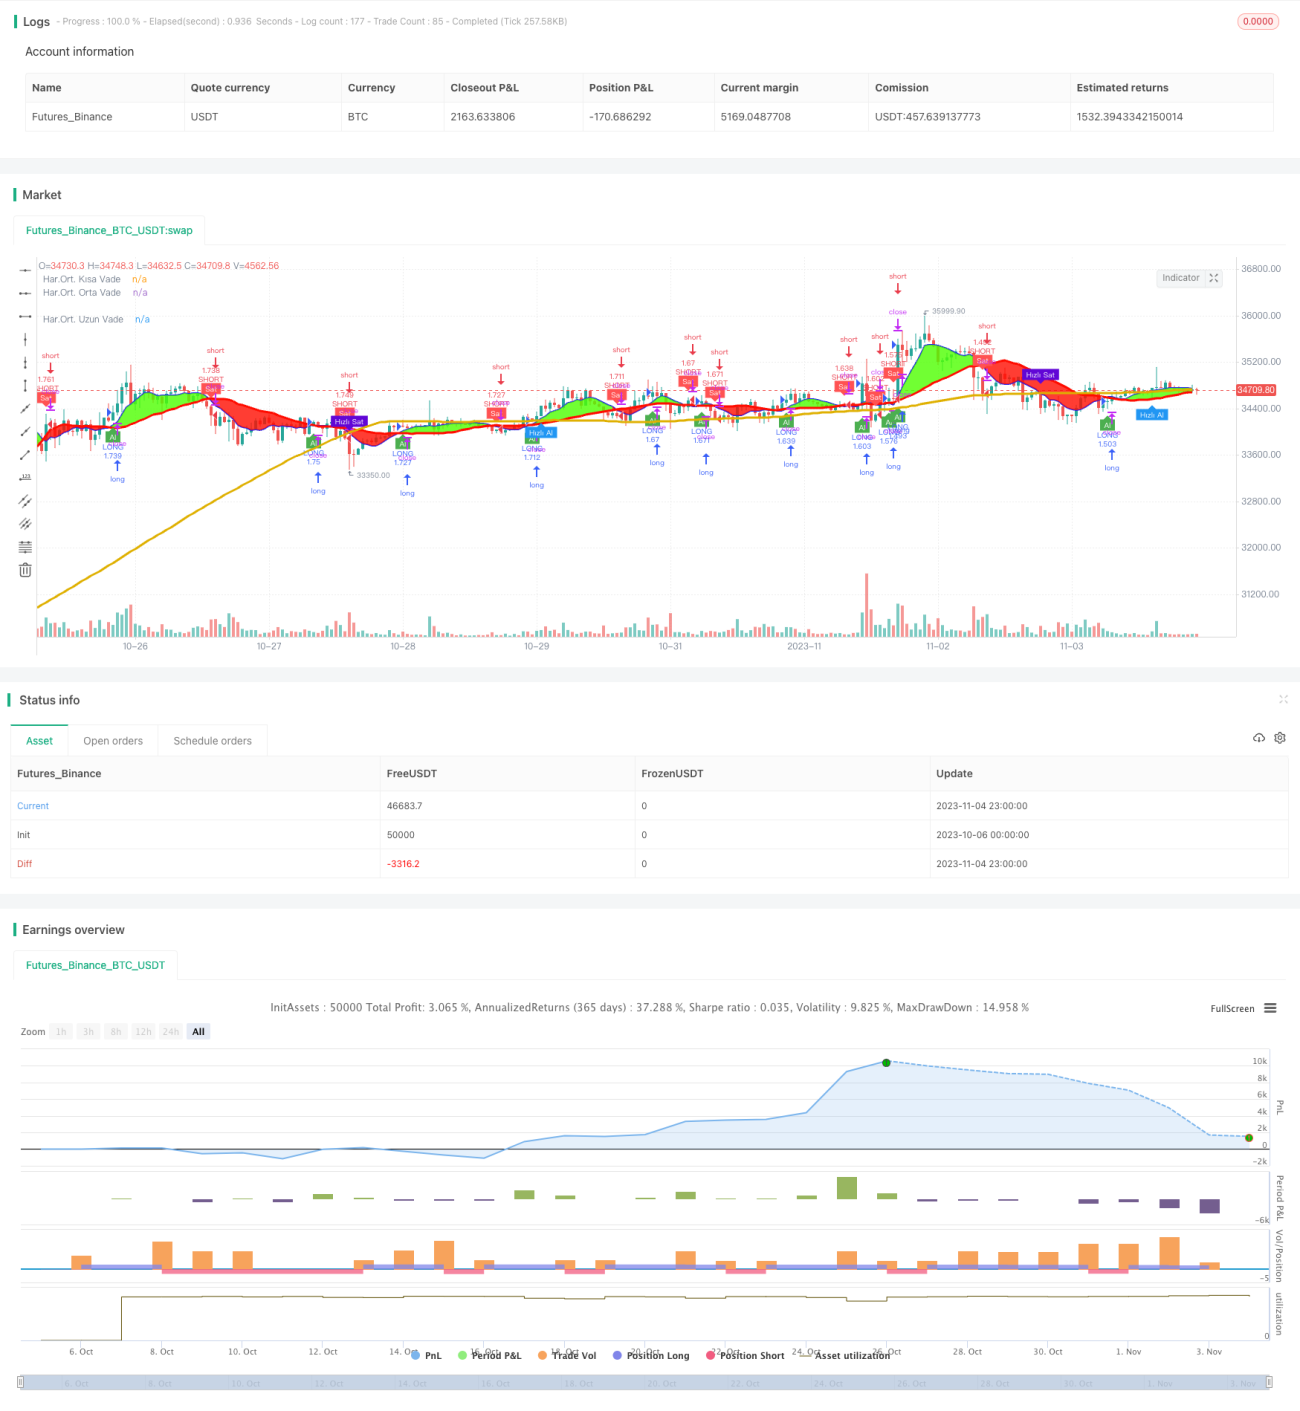
概要
三本の移動平均線のクロスを利用して買いシグナルと売りシグナルを生成するトレンド追従戦略です。短期・中期・長期の3本の移動平均線を使用し、それらのクロスに基づいて取引シグナルを形成します。
戦略の原理
本戦略ではまず、短期移動平均線(デフォルト7日)、中期移動平均線(デフォルト25日)、長期移動平均線(デフォルト99日)を計算し、以下のルールに従って取引シグナルを生成します。
- 短期移動平均線が中期移動平均線を上抜けた場合、買いシグナルを発生させます。
- 短期移動平均線が中期移動平均線を下抜けた場合、売りシグナルを発生させます。
- 短期移動平均線が長期移動平均線を上抜けた場合、迅速な買いシグナルを発生させます。
- 短期移動平均線が長期移動平均線を下抜けた場合、迅速な売りシグナルを発生させます。
この戦略は、短期移動平均線が中期移動平均線を上抜けることは市場トレンドが上昇に転じたことを示し、買いシグナルとなります。一方、短期移動平均線が中期移動平均線を下抜けることは市場トレンドが下落に転じたことを示し、売りシグナルとなります。同様に、短期移動平均線と長期移動平均線のクロスもより長期的なトレンド変化を捉えるための迅速な取引シグナルを生成します。
優位性分析
- 戦略ロジックがシンプルで明確であり、理解・実装が容易です。
- 複数の時間枠を分析することで、市場トレンドの変化を効果的に捉えることができます。
- 移動平均線の期間を調整することで、戦略パラメータの最適化が可能です。
- クロスシグナルが可視化され、トレンドの変化を直感的に反映します。
リスク分析
- 移動平均線には遅延性があり、トレンドの反転点を見逃す可能性があります。
- 強気市場では、短期線が長期線を上抜ける偽のシグナルが多発する可能性があります。
- 弱気市場では、短期線が長期線を下抜ける偽のシグナルが多発する可能性があります。
- 迅速な買い・売りシグナルは過敏になりやすく、取引回数や手数料が増加する可能性があります。
移動平均線の期間を適切に調整したり、フィルター条件を追加することで最適化し、偽シグナルを減らすことができます。また、迅速な取引期間を適度に短縮し、取引頻度を低減することも可能です。
最適化の方向性
- フィルター条件を追加する。例えば、一定の出来高や価格変動率を超えた場合のみシグナルを発生させる。
- MACDやKDJなどの他の指標と組み合わせてフィルタリングし、明確なトレンドがない場合の誤取引を回避する。
- 移動平均線の期間の組み合わせを最適化し、偽シグナルを低減する。
- 強気市場と弱気市場を区別し、買いと売りのパラメータを最適化する。
- 取引コストを考慮し、迅速な取引のパラメータを調整して取引頻度を制御する。
まとめ
三本線クロス戦略は全体的にシンプルで直接的であり、異なる時間枠の移動平均線のクロスによってトレンドの方向性を判断し、取引シグナルを生成します。この戦略は実装が容易でパラメータ調整の柔軟性も高く、トレンドの変化を捉えることができます。しかし、移動平均線の遅延や偽シグナルが多発するリスクも存在します。フィルター条件の追加やパラメータ組み合わせの最適化などにより、戦略の効果を改善することが可能です。本戦略は、トレンドクロスに興味のあるトレーダーが最適化して応用するのに適しています。
Source
Pine
Strategy parameters
Related strategies
Comment
All comments (0)
No data
- 1