マルチインジケーターボラティリティバンド取引戦略

概要
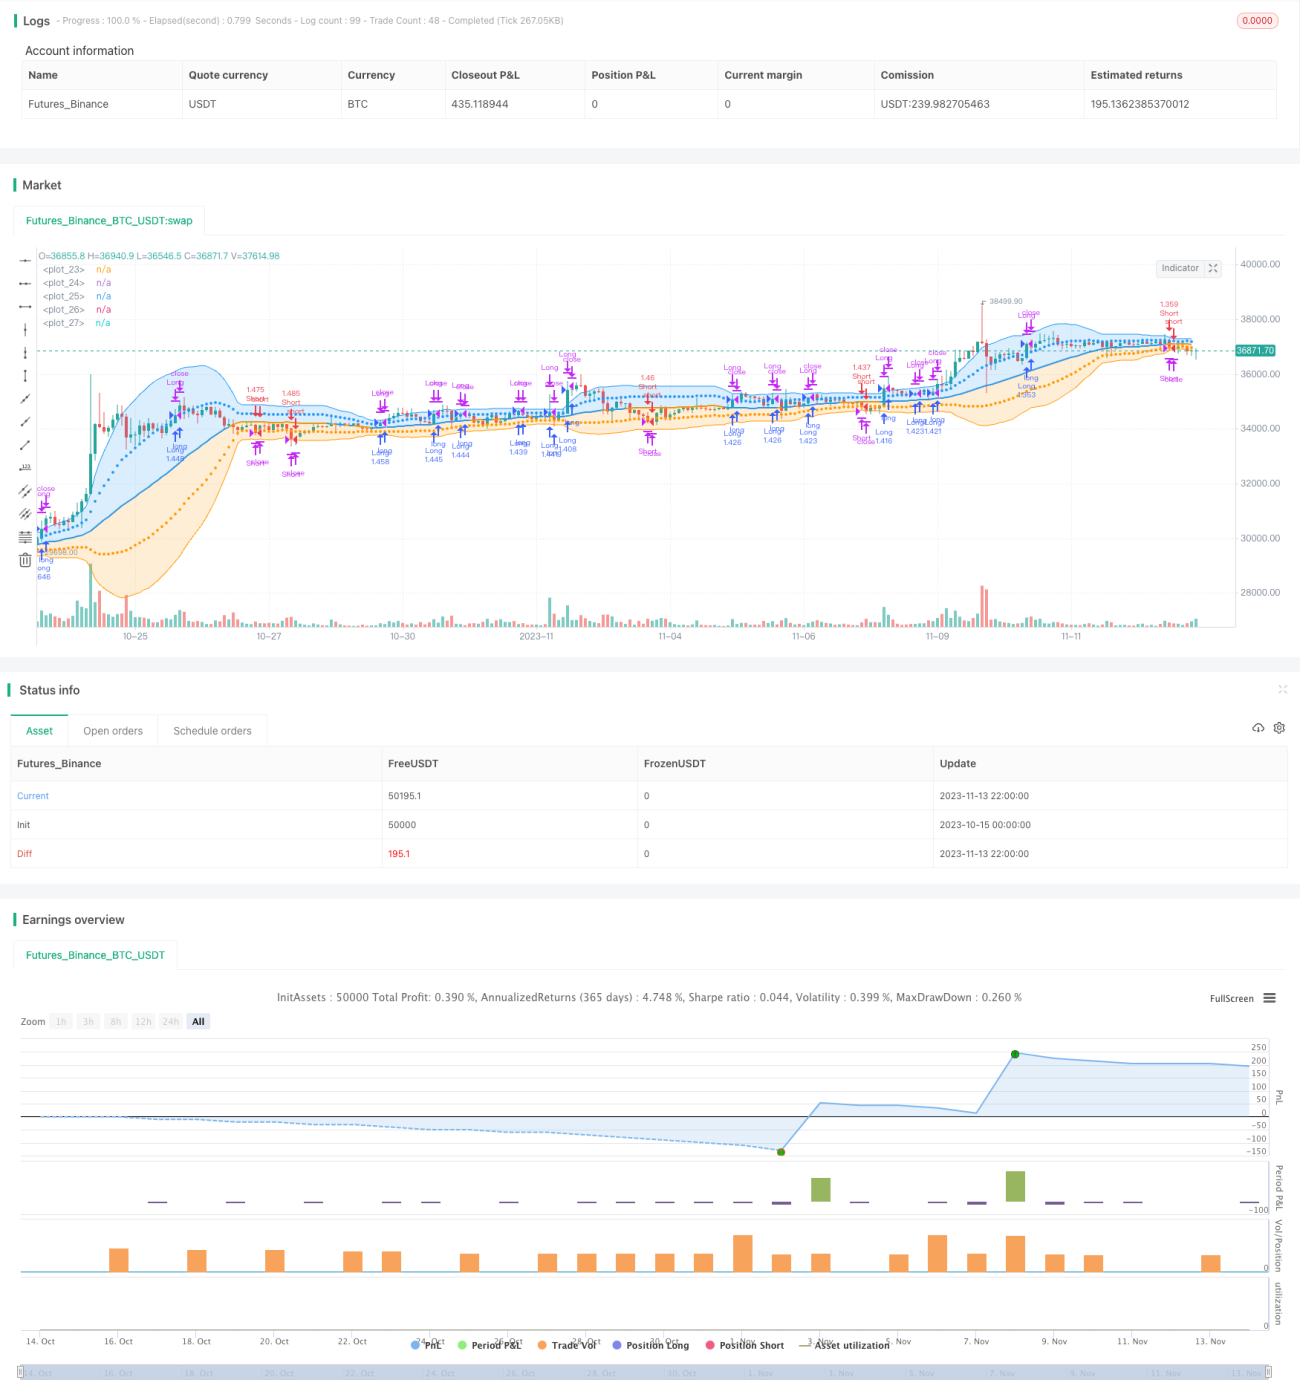
この戦略は,波動帯,相対的に強い指標,移動平均の分散指標などの複数の技術指標を統合して,買入決定を行う.この戦略は,最初に,グラフに伝統的な波動帯を描く.異なる2つの標準差を表示する2つの色の帯状の領域で異なる.波動帯が突破されているかどうかに基づいて,ポジションを開くことを決定する.また,この戦略は,RSIとMACDの指標を買入のシグナルとして使用します.全体的に,この戦略は,複数の技術指標を統合して,買入判断とポジション管理を行う総合的な取引戦略です.
戦略原則
-
まず,戦略は,中道,1つの標準差と2つの標準差の上下軌道を含む34周期の波動帯をグラフに描く.
-
閉盘価格の上から軌道に乗ったとき,多頭開設を行う.閉盘価格下から軌道に乗ったとき,空頭開設を行う.
-
多頭持仓では,閉盘価格を下回った場合の中間軌道を通過し,平仓多單.空頭持仓では,閉盘価格上回った場合中間軌道を通過し,平仓空單.
-
戦略はまた,RSI指標を導入し,RSIが70を超えると多頭開設の追加確認,RSIが30を下回ると空頭開設の追加確認である.
-
RSIが50を突破すると,平仓空券。RSIが50を突破すると,平仓多券。
-
戦略はまた,MACD指標を導入し,MACD金叉は多頭開設ポジションの追加確認として,MACD死叉は空頭開設ポジションの追加確認として.
-
MACDがデッドフォークであるとき,平仓は多券。 MACDが金フォークであるとき,平仓は空券。
-
以上をまとめると,この戦略は波動帯,RSI,MACDの3つの指標が同時に条件を満たす必要がある.平仓条件も3つの指標を考慮して,誤った信号の確率を減らす.
優位分析
複数の指標のフィルタリングシグナルを総合的に利用することで,誤った取引を効果的に回避できます. 波動が価格突破シグナルをもたらし,RSIフィルタリングは超買い超売り現象,MACDフィルタリングは市場情勢のトレンド変化,三者とも合同してシグナルを確認し,利益の確率を大幅に向上させることができます.
この戦略はまた,異なる開場・和平のポジションロジックを設定し,ポジションのリスクを厳格に制御している. 中間軌道,RSIの中間軸50およびMACDの金叉死叉は平仓条件として導入され,単一損失を減らすために迅速に止まります.
単一指標戦略と比較して,この戦略は複数の指標の優位性を統合し,利益率と勝利率を大幅に高め,最大撤退を減らすことができる.複数の指標の組み合わせフィルタは,誤った取引の確率を減らすことができる.厳格な止損機構は,各損失取引の影響を制御することができる.
全体として,この戦略は中長期トレンド取引に適しており,主要トレンドを把握し,指数詳細を利用して,被ばくを回避することができます.多指数リスク管理システムは,より高いレバレッジを安全に使用できるようにします.
リスク分析
この戦略には以下のリスクがあります.
-
指標が偽信号を発する確率。複数の指標を統合することで誤信号を減らすことは可能だが,完全に排除することは不可能。指標パラメータを最適化して偽信号率を下げる必要がある。
-
単一的な市場情勢では利益を得られない. 傾向が揺れると,止損が引き起こす可能性があり,利益を得ることが持続できない. 止損基準を適切に緩和し,ポジション保持期間を延長することができる.
-
一部の指標が遅れているため,最適な開設時間を逃す可能性があります.より高度な指標をテストして,早めに転向を捉えることができます.
-
大幅なジャンプ空隙は止損を無効にします.通路止損を設定するか,損失を制御するために段階的にポジションを増やすことができます.
-
パラメータは固定しすぎ,市場によって調整する必要がある.機械学習の自動最適化パラメータを導入することができる.
-
テストデータは不十分で,過適合がある可能性がある.戦略の安定性は,より長い期間と複数の市場でテストする必要がある.
最適化の方向
この戦略は,以下の点でさらに最適化できます.
-
指数パラメータを最適化して,より適切な波動帯周期,RSI周期,MACDパラメータの組み合わせを見つけ,偽信号を下げます.ステップ・ステップ,巡回法などの方法によって最適なパラメータを見つけることができます.
-
固定された中道停止ではなく,自己適応の停止メカニズムを追加する.ATR,トレンドなどの要因を組み合わせて,停止位置を動的に調整することができる.
-
機械学習技術を導入し,パラメータの自己適応的な最適化を実現する. 強化学習を使用して異なる市場状況でパラメータを最適化することができる.
-
トレンド判断のルールを増やし,異なる段階での異なる戦略を区別し,戦略のダイナミックな適応力を向上させる.
-
テキスト分析,ソーシャルデータなどの組み合わせにより,多要素予測が強化され,より高度な指標を用いて,転換点を早期に判断できます.
-
利回り最適化を行い,資金量に応じてポジションの規模を調整し,収益が指数型成長を実現できるようにする.
-
ポートフォリオを最適化し,非相関性を活用してポートフォリオの収益の変動性を低減するための補完的な戦略を模索する.
要約する
この戦略は,入場と出場を判断するために複数の技術指標を総合的に使用し,厳格な止損ルールを設定しています.単一の指標と比較して,複数の指標の組み合わせは,偽信号を大幅に削減し,利益の確率を向上させることができます.止損ルールは,各損失の影響を制御することもできます.この戦略は,トレンド状況に適合し,高い安定した収益を得ることができます.
/*backtest
start: 2023-10-15 00:00:00
end: 2023-11-14 00:00:00
period: 2h
basePeriod: 15m
exchanges: [{"eid":"Futures_Binance","currency":"BTC_USDT"}]
*/

//@version=5
// Bollinger Bands: Madrid : 14/SEP/2014 11:07 : 2.0
// This displays the traditional Bollinger Bands, the difference is
// that the 1st and 2nd StdDev are outlined with two colors and two- 1