ダイナミックボックス % トラッキング 戦略

作者: リン・ハーンチャオチャン, 日付: 2023-11-23 10:32:39
タグ:

img

概要

この戦略は,エントリーラインとストップ・ロスのラインを設定するためにパーセント価格変化を使用する.価格はエントリーラインを突破し,価格はストップ・ロスのラインを下回るとポジションを終了する.主な特徴は,リスクの1ユニットしか負わないことであり,前回のポジションが既定の利益目標に達した後のみ新しいポジションが追加されるということです.

原則

ストラテジーは,まずベンチマーク価格を設定し,その価格の10%を価格範囲として使用します.上限はエントリーラインで,下限はストップ損失ラインです.価格がエントリーラインを突破すると,固定量が購入されます.価格がストップ損失ラインを下回ると,ポジションは閉鎖されます.利益を得た後に,エントリーラインとストップ損失ラインは利益範囲を拡大するためにパーセントで調整されます. これにより,戦略はトレンドランスを追跡することができます.

戦略のもう1つの重要な点は,リスクの1単位しか負わないことです.つまり,現在のポジションが利益目標に達した後のみ新しいポジションが追加されます.新しいポジションは新しいエントリーとストップ損失ラインもフォローします.これはリスクを制限します.

利点分析

この戦略は,トレーリングストップとポジションサイジングの利点を組み合わせて,収益性のある同時,効果的なリスク管理を可能にします.

  1. 入口線とストップ・ロスの割合範囲を使用することで,自動的なトレンド追跡が可能になります.
  2. リスクは1桁に限定され,大きな損失を回避する
  3. 新しいポジションは利益後だけに追加され,傾向を追求するのを避けます
  4. ストップ・ロスの線は,利益の後,上昇し,利益を固定します.

リスク分析

リスクもあります:

  1. リスクが拡大する
  2. 範囲が狭すぎると,利益の可能性は限られている
  3. 誤ったストップ・ロスの配置は,早期終了につながる可能性があります.
  4. 攻撃的な追加は損失を増大させる

このリスクは,レンジサイズ,エントリーフィルターなどのパラメータを調整することで回避できます.

最適化

さらに最適化できる余地があります.

  1. トレンド指数と組み合わせて,トレンド方向を決定する
  2. より適応性の高いラインのための機械学習モデルを追加
  3. リスクを下げるために異なる追加条件をテストする
  4. テストによって最適な保持期間を見つける

結論

これはシンプルで実用的な百分比範囲ベースのシステムです.パラメータ調節とモデル最適化によって,この戦略は信頼できるトレンド追跡ツールになり,投資家にとって安定したパフォーマンスを生み出すことができます.


/*backtest
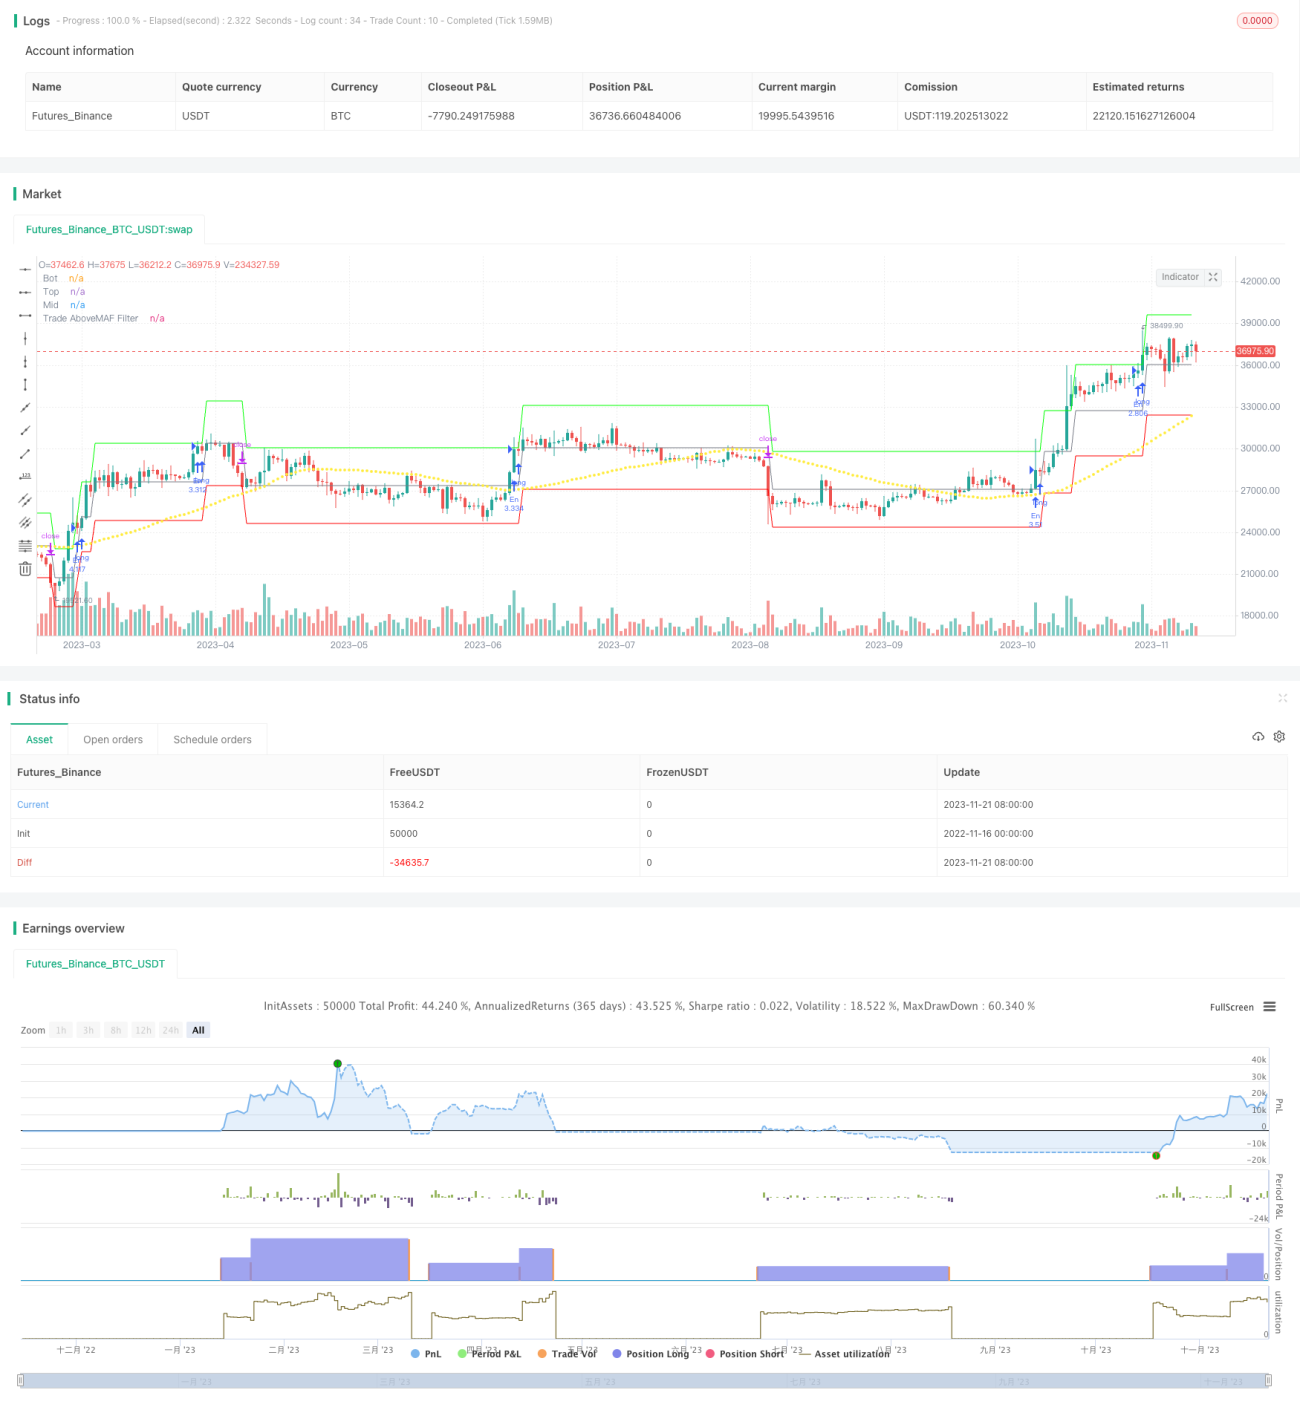
start: 2022-11-16 00:00:00
end: 2023-11-22 00:00:00
period: 1d
basePeriod: 1h
exchanges: [{"eid":"Futures_Binance","currency":"BTC_USDT"}]
*/

//@version=4
// This source code is subject to the terms of the Mozilla Public License 2.0 at https://mozilla.org/MPL/2.0/
// © HermanBrummer 4 April 2021

strategy ("The Box Percent Strat", shorttitle="The Box", overlay = true)

///     Designed for LONG only on Daily, 2D or 3D Charts
///     Uses fixed investment risk amount, meaning you're willing to lose that amount per trade
///     Limit buy to not overpay

RiskPerTrade            = input(10000, "Risk losing this much per trade", tooltip="This calculates how much you will lose based on difference between the entry price and stop loss price")
TradeAboveMAFilterPer   = input(50, "The System won't trade if price is below this MA")

UpBoxSize               = (input(10, "Box size in %") * 0.01)+1 // 1.1 == 10% up
DnBoxSize               = 1-(input(10, "Box size in %") * 0.01) // 0.9 == 10% dn


var FirstBar            = close > 0 ? close : na
var FirstTop            = FirstBar * UpBoxSize
var FirstBot            = FirstBar * DnBoxSize


var top                 = sma(FirstTop, 1)
var bot                 = sma(FirstBot, 1)

///     The Box Calcs
if  high[2] > top
    top                 := top * UpBoxSize
    bot                 := bot * UpBoxSize
if  low[1]  < bot
    top                 := top * DnBoxSize
    bot                 := bot * DnBoxSize

 
plot(bot,   "Bot",      #ff0000) // Green
plot(top,   "Top",      #00ff00) // Red

mid                     = ((top-bot)/2)+bot 
plot(mid,   "Mid", color.gray)

TradeAboveMAFilter      = sma(close, TradeAboveMAFilterPer)
plot(TradeAboveMAFilter, "Trade AboveMAF Filter", color.yellow, 3, style=plot.style_circles)

// col = high[1] < top and high >= top ? color.white : na
// bgcolor(col)


///     Shares
RiskRange                   = close * abs(DnBoxSize - 1) // 0.9 - 1 == 1.10 // 10% abs so you don't get a neg number NB NB
Shares                      = RiskPerTrade / RiskRange 
//plot(close-RiskRange, "RiskRange", color.fuchsia)

Enter   =   high >= top
             and close[1] > TradeAboveMAFilter
             and strategy.opentrades[0] == strategy.opentrades[1]
             and strategy.opentrades[1] == strategy.opentrades[2] 
             and strategy.opentrades[2] == strategy.opentrades[3]
             and strategy.opentrades[3] == strategy.opentrades[4] 
             and strategy.opentrades[4] == strategy.opentrades[5]
             and strategy.opentrades[5] == strategy.opentrades[6]
             // won't enter if new positon was taken in the last 6 bars
             // need better code for this.

///     Buy & Sell
//  (new highs)    and  (Close above moving average filter) and (No new trades were taken receently)
if  Enter //(high >= top)  and  (close[1] > TradeAboveMAFilter) and strategy.opentrades[0] == strategy.opentrades[1] 
    strategy.order("En", strategy.long, qty=Shares, limit=top)//, stop=top)
    
//barcolor(strategy.position_size != 0 ? #00ff00 : color.gray)


// ///     If ONE Position THEN this Stop Because: 
// if  strategy.position_size == 1
//     strategy.exit("Ex", "En", stop=bot)
///     If it has more than one trad OPEN
if  strategy.position_size > 0
    strategy.exit("Ex", "En", stop=bot[2] )   // puts stop on old bot

//plot(strategy.position_avg_price, "Avg Price", color.yellow)


もっと