モメンタムブレイクアウト移動平均戦略

概要
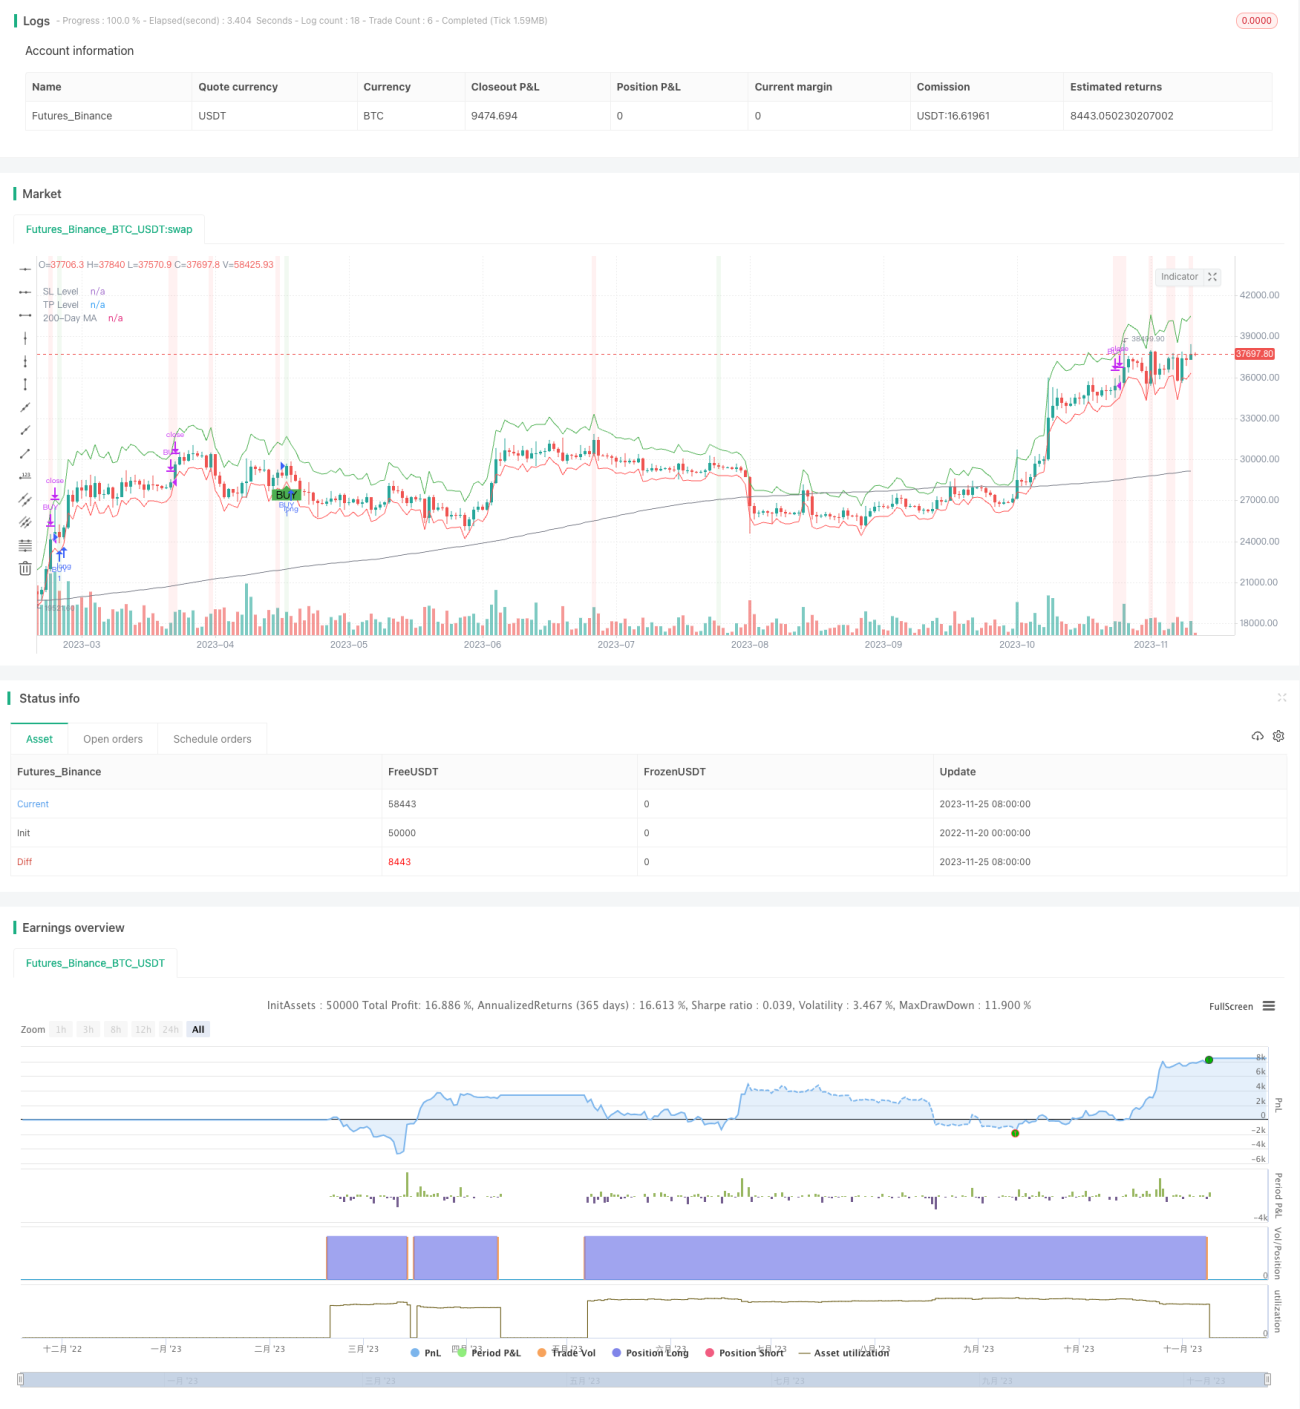
動量突破均線戦略は,均線交差信号と動量指標を組み合わせた株式取引戦略である.この戦略は,インデックス移動平均 ((EMA),シンプル移動平均 ((SMA),移動平均分散指数 ((MACD),および修正された比較的強いインデックス ((StockRSI) など,複数の技術指標を総合的に使用し,長期の傾向が上昇していることを確認した前提で買い信号を形成する.短期間の動量指標が反転信号を示したときに,戦略はストップ・ロスを取る.
戦略原則
この戦略は以下の要素で構成されています.
-
EMA/SMA均線交差: 9周期のEMA快線と21周期のSMA慢線を設定し,快線が慢線を横切るときに買い信号を生成する.
-
MACD指数についてMACD指数は,MACD線,シグナル線,MACD柱を含む.柱が正し,EMA/SMAから発生した買い信号と同期しているときに,追加の確認として.
-
ストックRSI: StockRSIは,改良版のRSI指標である。指標線がOVERBOUGHT線 ((80) よりも高く,またはOVERSOLD線 ((20) よりも低く,購入シグナルが生じる。
-
ブリン帯: ブリンの中間軌道は20日SMAで,帯域は上記の2つの基準の差である. 価格がブリン帯内にある場合にのみ取引シグナルが生成されることを要求する.
-
ストップ・ローズとストップ・ポジションストップ・ストップ・価格は,過去14日のATRに基づいて計算されています.
この戦略は,上記の指標のうち少なくとも2つの指標が同時に買い信号を発し,株価がブリン帯内にあり,長期的に上昇傾向にあることが必要であるため,最終的な買い信号が生じる. MACD指標が下向きに逆転すると,StockRSIが超買い領域に入った後に売り信号が生じる.
優位分析
この戦略は均線交差,運動量指数および波動率指数の利点を組み合わせて,以下の主要な利点があります.
-
**素晴らしい結果でした.**複数の指標が成熟した指標で,大盤と単一の指標よりも戦略的な結果が優れている.
-
パラメータは最適化されています.: EMA周期,ブリン帯通路などの主要パラメータが最適化され,システムの安定性を向上させる.
-
自動停止/停止: ブリンベルトとATRは,リスク管理に有利な,リアルタイムでストップを調整できます.
-
実施の難しさは少ない: コードが簡潔で,指標は簡単に入手でき,実際の操作は困難ではない.
リスク分析
この戦略はうまくいっているものの,主なリスクは以下の通りです.
-
指示器が誤った信号を出している: 市場が異常な波動や指標の失敗に遭遇すると,誤ったシグナルが発生する可能性があります.このとき,長期のトレンド判断を組み合わせて行うべきです.
-
パラメータが正しくない:パラメータの設定が不適切である場合,取引が頻すぎたり,反応が不快になる可能性があります.異なる品種や市場環境に応じて調整する必要があります.
-
ストップダメージが小さいか大きいか: 止損が小さすぎると,簡単に捕らえられ,大きすぎると,損失が大きすぎます. 止損と止<unk>をバランスする必要があります.
上記のリスクに対して,以下のような対策を講じることができます.
-
人工介入と改造: 異常が発生した場合,信号を人工的に確認し,パラメータを変更するか,ポリシーを一時停止する.
-
パラメータの設定を最適化遺伝的アルゴリズムなどより科学的に客観的な方法を採用してパラメータを最適化する.
-
変動率調整によるストップ: 波動率に応じて自動的にストップ・ローズ幅を調整できます.例えば1-3倍ATR。
最適化の方向
この戦略は,以下の点でさらに改善できます.
-
損失防止メカニズムの安定性を高める: トラッキングストップまたはインデックス移動平均のストップを追加できます.
-
取引量フィルターと組み合わせた: 取引量指数に追加して,無効突破を回避する.
-
動的調整パラメータ: 市場環境に応じて平均線周期,通路幅等を自動的に最適化することができる.
-
機械学習アルゴリズムを導入する:RNN,LSTMなどのアルゴリズムを使用してパラメータを実現する動的最適化。
要約する
動量突破均線戦略総合応用技術指標の優位性,長短走配合の場合,良好な収益が得られた。この戦略の止損制御は整えられ,実施の難しさはあまりなかった。次のステップは,止損機構をさらに完善し,より知的な方法を使用してパラメータ最適化と信号フィルタリングを行い,より安定した余剰収益を得ようとする。
- 1