ボルテックスオシレータートレンドフォロー戦略

概要
渦巻き振動器のトレンド追跡策略は,渦巻き指標に基づくトレンド追跡策略である.それは,複数の異なる周期の移動平均を使用して渦巻き指標を構築し,価格の潜在的傾向を識別し,より短い周期の移動平均を補助判断として組み合わせて,低リスクのトレンド追跡操作を実現する.
戦略原則
この戦略の核心指標は渦巻き指標である.渦巻き指標は,複数の異なる周期の短期,中期,および長期の移動平均で構成されている.具体的には,戦略は,6日,27日,72日,および234日の4周期の移動平均を使用している.短期移動平均は,価格の最新のトレンドを反映し,長期移動平均は,価格の長期トレンドを反映している.指標の核心論理は,短期移動平均の上で長期移動平均の横断をすると,価格上昇の勢いが強くなることを示すとき,購入する;短期移動平均の下に長期移動平均の横断をすると,価格上昇の勢いが弱くなることを示すとき,売るべきである.
渦巻き指標の顕著な優点は,トレンド判断の正確さであり,市場騒音を効果的にフィルターできるものである.しかし,その反応は十分敏感ではないため,ターニングポイントを間に合うように捕捉することができない.したがって,戦略は,より敏感な6日移動平均を加え,補助判断指標を構築している.渦巻き指標と補助指標が,ゼロ軸を上向きに移動するときに買入し,ゼロ軸を下向きに移動するときに売る.これは,トレンドの方向と強さを判断する渦巻き指標を形成し,購入と売却の多重確認の論理を判断する補助指標を形成し,偽の信号を過渡すると同時に操作の感性を高めている.
優位分析
この戦略の最大の利点は,判断の正確さ,操作の敏感さにある.渦巻き指標と補助指標の組み合わせは,トレンド判断と具体的な買賣点の決定の有機的統一を実現し,各部門の役割は相互の干渉を避ける.複数の確認機構は,市場ノイズを効果的にフィルタリングし,誤った操作を避ける.同時に補助指標の加入は,戦略の操作の敏さも保証する.
単一の指標戦略に比べて,この戦略は複数の指標を総合的に利用し,市場の変化を認識し,対応する能力が強くなっている.大傾向が変わらない場合,戦略は安定した利益を達成することができる.大傾向が変化したとき,戦略は迅速に反応し,損失を減らすことができる.
リスク分析
この戦略の主なリスクは,指標パラメータの設定不適切と突発事件の影響にある.移動平均パラメータの設定は,感度とノイズ干渉に対する抵抗力をバランスさせる必要がある.パラメータの設定不適切であれば,戦略の異常な行動を引き起こす.さらに,重大な突発事件は,指標を無効にし,誤った取引を生むために,価格の急激な変動を引き起こす可能性があります.
これらのリスクを軽減するために,パラメータの組み合わせを最適化し,指標のパフォーマンスをより安定させるために反測を行うことをお勧めします.また,重要な出来事によってもたらされる市場の影響に注意し,必要に応じて戦略を一時停止し,異常波動期間の誤操作を避ける必要があります.価格の傾向が下がるとき,ポジションを徐々に減らすことも有効な保安手段です.
最適化の方向
この戦略は以下の点で最適化できます.
-
移動平均のパラメータを最適化し,指標の抗干渉能力と操作感性を向上させる.異なる長さのパラメータの組み合わせを試し,平らで敏感な指標を選択することができる.
-
止損メカニズムを増やす. 価格が不利な方向に重要なサポートを突破したときに止損点を設定し,さらなる損失を避ける.
-
他の指標判断と組み合わせて,戦略の安定性を高めます.例えば,取引量指標を追加すると,取引量が大きくなった場合にのみ取引信号が生じます.
-
異なる市場段階に応じて異なるパラメータの組み合わせを使用する.例えば,牛市ではより積極的なパラメータを使用し,熊市ではより安定した設定を使用する.
要約する
渦巻き振動器のトレンド追跡戦略は,価格トレンドの方向と強さを判断するために渦巻き指標を使用し,より敏感な短期移動平均で特定の買い物タイミングを決定します. この戦略は,トレンド判断と取引実行の2つのレベルを組み合わせて,操作の安定性を保証し,戦略の柔軟性を向上させます.パラメータの最適化,止損設定および状態メカニズムの導入により,戦略のリスク抵抗性をさらに強化し,より優れた反測指標と現場パフォーマンスを得ると期待されています.
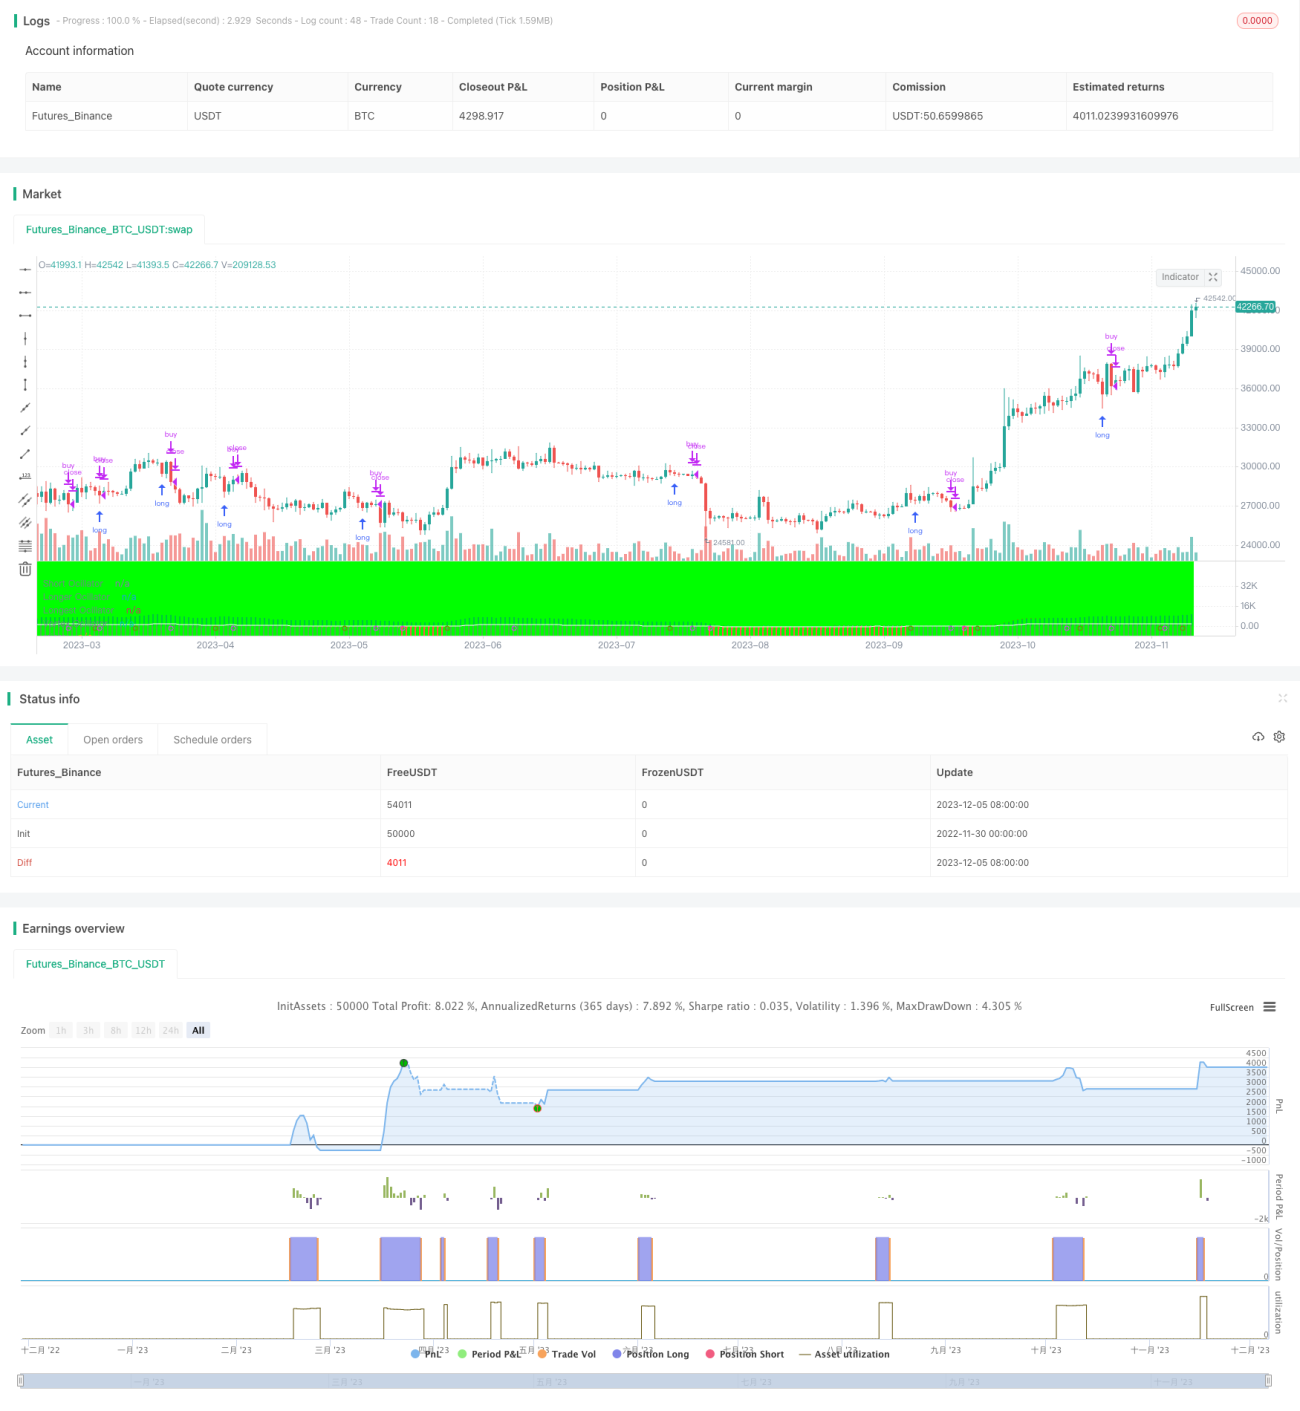
/*backtest
start: 2022-11-30 00:00:00
end: 2023-12-06 00:00:00
period: 1d
basePeriod: 1h
exchanges: [{"eid":"Futures_Binance","currency":"BTC_USDT"}]
*/

//@version=3
//swap strategy line for study line to enable backtesting
strategy(title="Vortex Ocillator" )
//study(title = "Vortex Oscillator", precision = 6)- 1