ダイナミックATRトレーリングストップロス戦略
概要
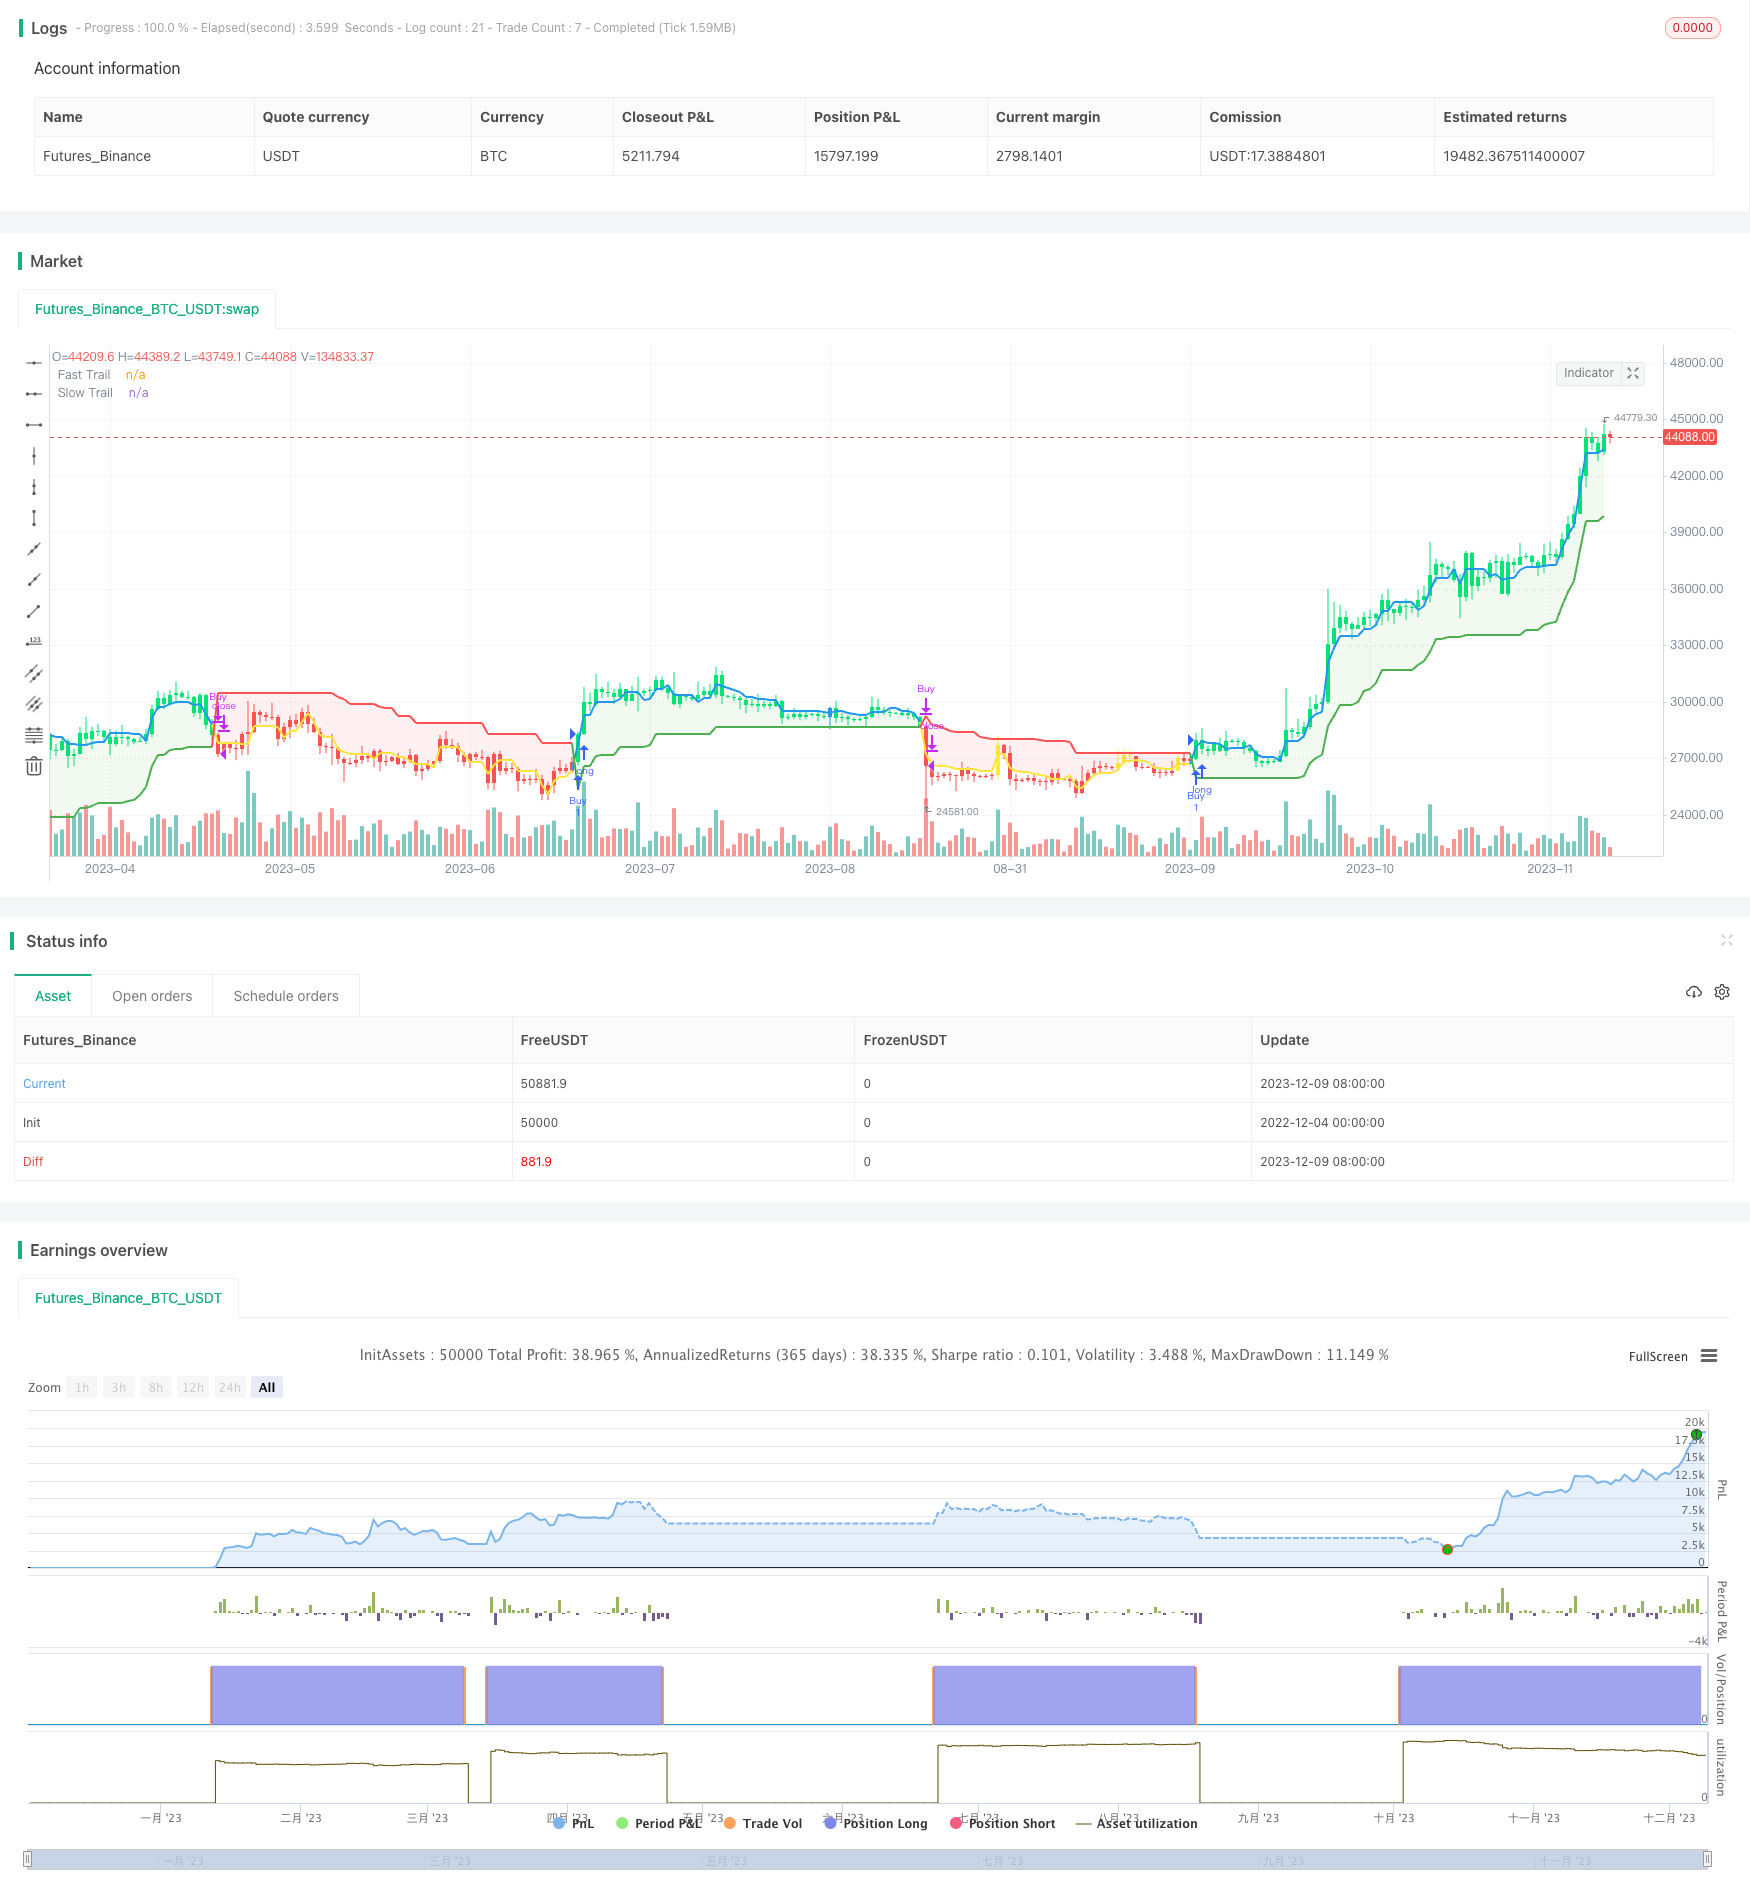
この戦略はATR指標をベースに設計されたダイナミック・トラッキング・ストップ・メカニズムで,ストップ・ポジションをリアルタイムで調整し,より大きな利益を得ることができます.
戦略原則
戦略は,高速ATRサイクル5と遅いATRサイクル10を使用して二重のダイナミック・トラッキング・ストローを構築する.価格が有利な方向に走っているとき,高速層は最初に追跡を開始し,ストップポジションを締め込む.価格が短期的な回調をするとき,遅い層のストップポジションは,早すぎるストップを回避する.同時に,高速層の間の交差は取引信号として働く.
具体的には,高速層のストップ距離は0.5倍5周期ATRであり,遅い層のストップ距離は3倍10周期ATRである.高速層が上方突破すると買入シグナルが生じ,高速層が下方突破すると売り出シグナルが生じます.ストップラインはリアルタイムで更新され,価格曲線の下に描かれます.
優位分析
この戦略の最大の利点は,ストップポジションを動的に調整することができ,ストップを保証した前提で,最大限の利益を得ることを目指すことです.固定ストップ距離と比較して,ダイナミックATRストップラインは,市場の波動程度に応じて調整することができ,ストップが活性化される確率を減らすことができます.
さらに,双層ATR設計は,停止の感度を均衡させることができる.高速層は迅速に反応し,遅い層は,短期的なノイズをフィルターして,早期停止を防ぐことができる.
リスク分析
この戦略の主なリスクは,止損距離の設定が合理的であるかどうかにある.ATR倍数が大きすぎると,止損幅は価格の運行に追いつかない.ATR倍数が小さすぎると,短期的なノイズに阻害されやすい.したがって,異なる品種の特徴に応じてパラメータを調整する必要がある.
また,整合の状況ではATRは小さく,止損線に近いので,頻繁に止損されやすい.したがって,この戦略は一定の波動率を持つ品種に適しています.
最適化の方向
異なるATR周期パラメータの組み合わせを試し,最適なバランスを探すことができます.また,他の指標と組み合わせて使用することも考えることができます.例えば,トレンド指標は市場段階を判断し,ATR倍数の大きさを動的に調整できます.
また,代替ATR指標の可能性も研究できる.ATRをDKVOL,HRANGEまたはATRパーセントなどの指標値に変更することで,より良い止損効果が得られる可能性がある.
要約する
この戦略はATR指標をベースに二層のダイナミック・トラッキング・メカニズムを設計し,より大きな利益を得るために,過剰なストップを回避できます. ストップ要求が高いユーザーに適しています. この戦略は,市場と品種特性に応じてパラメータを柔軟に調整して,最適なストップ効果を達成できます.
/*backtest
start: 2022-12-04 00:00:00
end: 2023-12-10 00:00:00
period: 1d
basePeriod: 1h
exchanges: [{"eid":"Futures_Binance","currency":"BTC_USDT"}]
*/

//@version=4
strategy("ATR Trailing Stop Strategy by ceyhun", overlay=true)

/////////notes////////////////////////////////////////
// This is based on the ATR trailing stop indicator //
// width addition of two levels of stops and        //
// different interpretation.                        //
// This is a fast-reacting system and is better     //
// suited for higher volatility markets             //
//////////////////////////////////////////////////////

SC = input(close, "Source", input.source)

// Fast Trail //
AP1 = input(5, "Fast ATR period", input.integer)  // ATR Period
AF1 = input(0.5, "Fast ATR multiplier", input.float)  // ATR Factor
SL1 = AF1 * atr(AP1)  // Stop Loss
Trail1 = 0.0
Trail1 := iff(SC > nz(Trail1[1], 0) and SC[1] > nz(Trail1[1], 0), max(nz(Trail1[1], 0), SC - SL1), iff(SC < nz(Trail1[1], 0) and SC[1] < nz(Trail1[1], 0), min(nz(Trail1[1], 0), SC + SL1), iff(SC > nz(Trail1[1], 0), SC - SL1, SC + SL1)))

// Slow Trail //
AP2 = input(10, "Slow ATR period", input.integer)  // ATR Period
AF2 = input(3, "Slow ATR multiplier", input.float)  // ATR Factor
SL2 = AF2 * atr(AP2)  // Stop Loss
Trail2 = 0.0
Trail2 := iff(SC > nz(Trail2[1], 0) and SC[1] > nz(Trail2[1], 0), max(nz(Trail2[1], 0), SC - SL2), iff(SC < nz(Trail2[1], 0) and SC[1] < nz(Trail2[1], 0), min(nz(Trail2[1], 0), SC + SL2), iff(SC > nz(Trail2[1], 0), SC - SL2, SC + SL2)))

// Bar color for trade signal //
Green = Trail1 > Trail2 and close > Trail2 and low > Trail2
Blue = Trail1 > Trail2 and close > Trail2 and low < Trail2
Red = Trail2 > Trail1 and close < Trail2 and high < Trail2
Yellow = Trail2 > Trail1 and close < Trail2 and high > Trail2

// Signals //
Bull = barssince(Green) < barssince(Red)

Buy = crossover(Trail1, Trail2)
Sell = crossunder(Trail1, Trail2)

TS1 = plot(Trail1, "Fast Trail", style=plot.style_line, color=Trail1 > Trail2 ? color.blue : color.yellow, linewidth=2, display=display.none)
TS2 = plot(Trail2, "Slow Trail", style=plot.style_line, color=Trail1 > Trail2 ? color.green : color.red, linewidth=2)
fill(TS1, TS2, Bull ? color.new(color.green, 90) : color.new(color.red, 90))

plotcolor = input(true, "Paint color on chart", input.bool)

bcl = iff(plotcolor == 1, Blue ? color.blue : Green ? color.lime : Yellow ? color.yellow : Red ? color.red : color.white, na)
barcolor(bcl)

if Buy
    strategy.entry("Buy", strategy.long, comment="Buy")

if Sell
    strategy.close("Buy")