マルチファクター組み合わせ適応移動平均戦略

戦略概要
多因子組合せ自在移動平均戦略は,日内線,移動平均線,聚合交差線およびHA均線を同時に使用する複合戦略である.この戦略は,牛市でより高い累積利益を得るためにより多くの取引機会を掘り起こすことを目的としている.
2. 戦略の原則
この戦略の核心的な論理は,複数の技術指標を組み合わせて,買入・売却のシグナルを評価し,異なる要因のマッチングの結果に応じて,異なる強さの取引シグナルを与えることです.
具体的には,この戦略で使われる4つの主要な技術指標は以下の通りです.
-
日内線。策略は日内線の色を使って価格トレンドを判断し,連続した2つの緑の実体HA平均線は買い信号であり,連続した2つの赤の空心HA平均線は空頭信号。
-
移動平均. 戦略は,同時に,快速,遅速,フィルタリングの3つの異なるパラメータの設定を使用する移動平均. 速い線が遅速線を横切るとき,遅速線が<unk>線を横切るとき,買いの信号;逆に,売りの信号. 移動平均は,中長期のトレンドを効果的に判断する.
-
ストキャスティック指数。この指数は多空交差のタイミングを判断する。%K線が下方向から%D線を突破すると,買入信号;上方向から下方向から突破すると,売出信号。
-
マッチングスコアメカニズム 以上の複数の要因のマッチング状況に応じて,戦略はスコアメカニズムを採用する.マッチング要因が多くなるほど,対応信号の強さも大きい.
複数の要因を総合的に判断することで,戦略は中短期間でより微妙な取引機会を捉え,牛市で余分な利益を得ることができます.
3 戦略的優位性
多因子組合せ移動平均策の最大の利点は,信号の信頼性を高めることです.単一の技術指標は誤信号に容易であり,この策は,複数の指標を組み合わせて使用することで,偽信号の干渉を効果的に減らすことができます.
また,単一の指数に従うよりも,多要素の組み合わせにより取引の勝利率が向上します.牛市では,戦略により高い累積利益を得ることができます.
4 戦略的リスク
この戦略の主なリスクは,多因子組合せ自体が戦略の複雑さを増加させるということである.複数の指標のパラメータ設定,頻繁な調整などを同時に考慮する必要がある.
また,熊市では,戦略的なポジションの保持時間が長すぎることがあります. ストップ・ロスを設定しても,大きな損失を回避することは困難です.
さらに,ストキャスティック指数やHA均線などの技術指数は,突発事件の影響を受けやすいため,誤信号を発生し,不必要な損失を引き起こす可能性があります.
5 戦略の最適化方向
この戦略は以下の点で最適化できます.
-
各指標パラメータの設定を最適化して,最適なパラメータの組み合わせを見つけます.
-
モデルのトレーニングとパラメータの自己適応モジュールを追加し,パラメータをリアルタイムで最適化します.
-
ストップ・ローズ戦略を増加させ,最大撤退策を減少させる.
-
ポジションコントロールモジュールを追加し,市場状況に応じてポジションを動的に調整する.
-
機械学習アルゴリズムと組み合わせた,多因子評価のニューラルネットワークモデル.
VI. 結論
多因子組合せは,移動平均戦略に自律的に適応し,複数の技術指標の優位性を総合的に利用する.この戦略は,信号の質を効果的に高め,牛市で余分な収益を得ることができる.しかし,同時に,戦略の複雑さを増加させ,さらなるテストと最適化が必要である.
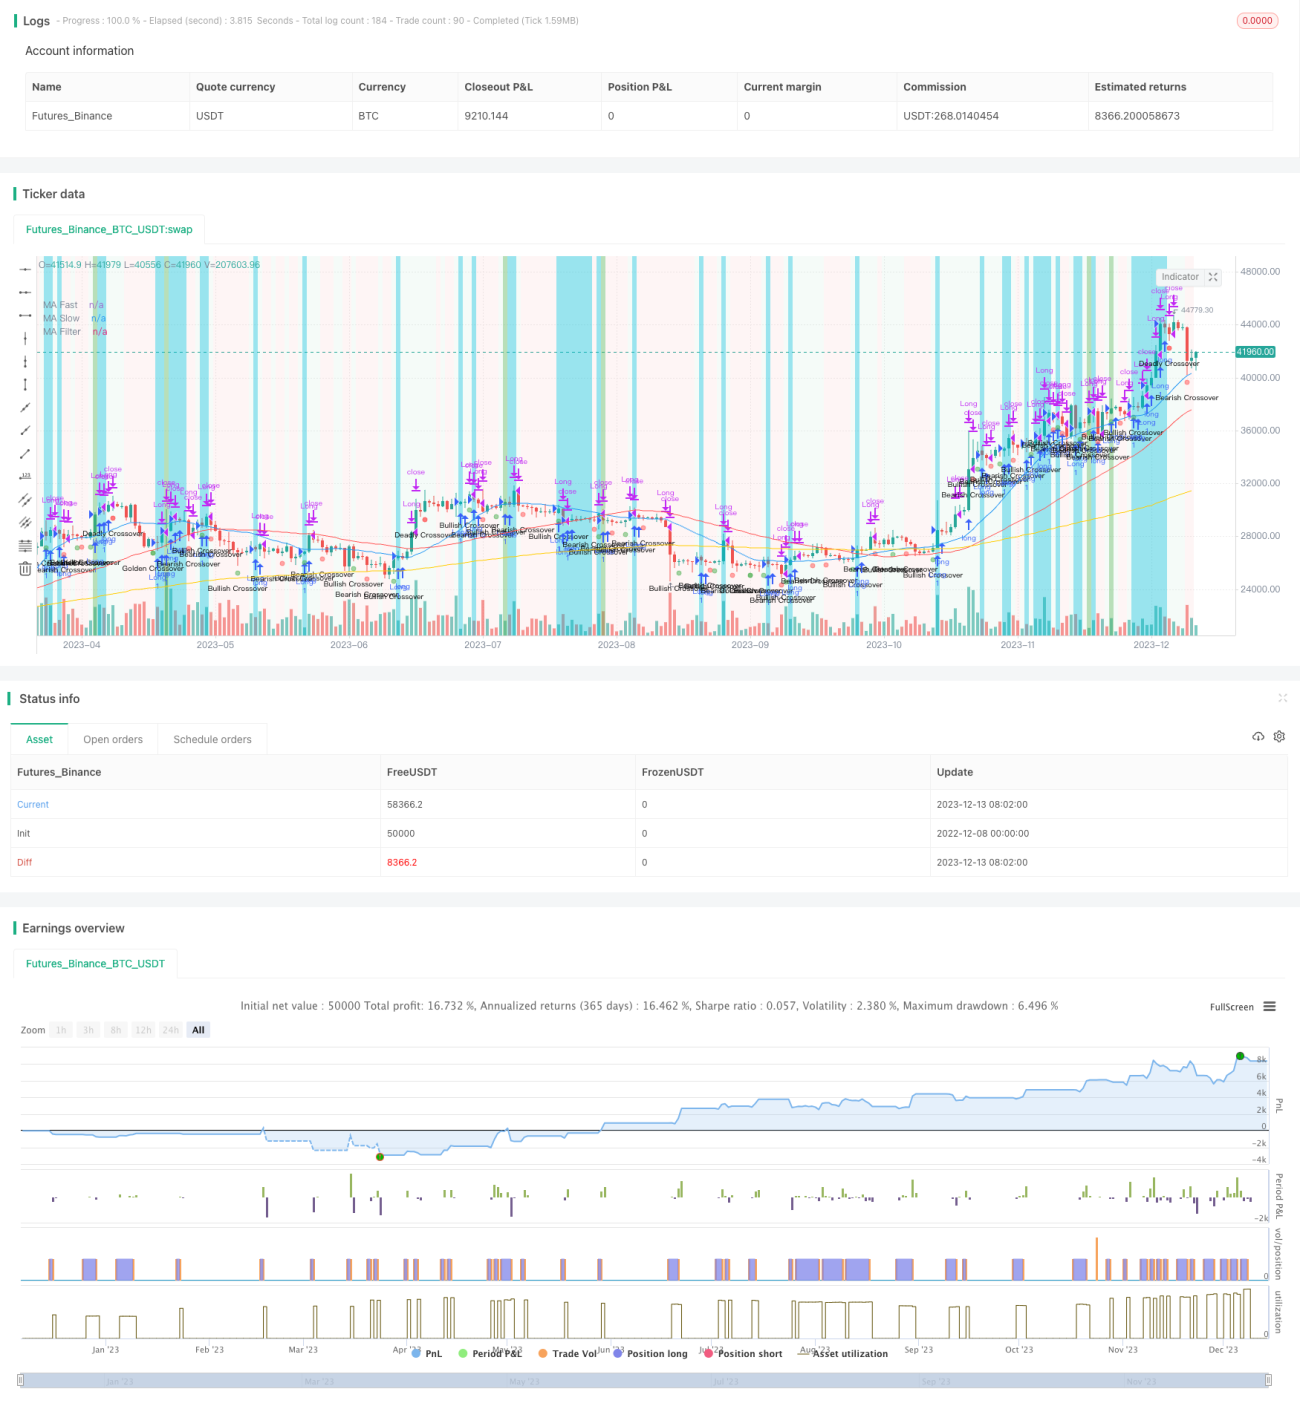
/*backtest
start: 2022-12-08 00:00:00
end: 2023-12-14 00:00:00
period: 1d
basePeriod: 1h
exchanges: [{"eid":"Futures_Binance","currency":"BTC_USDT"}]
*/

// This source code is subject to the terms of the Mozilla Public License 2.0 at https://mozilla.org/MPL/2.0/
// © cyrule
//@version=4
strategy("2nd Grade Strategy", overlay=true, shorttitle="2GTS", max_lines_count = 500, max_labels_count = 500, calc_on_every_tick = true, calc_on_order_fills = true, pyramiding = 1, default_qty_type = strategy.percent_of_equity, default_qty_value = 10)- 1