マルチファクターモデルに基づく適応型トレンド追従戦略

概要
この戦略は,多要素モデルの駆動による自適性トレンド追跡戦略である.それは,RSI,MACD,Stochasticsなどの複数の指標を統合し,多要素モデルの判断トレンドの方向を構築する.同時に,それは,自適性ストップ・メカニズムを有し,ATRの動向に応じてストップ・価格を調整し,リスク制御を実現する.
原則
この戦略は,複数の指標を用いてトレンド判断のモデルを構築する.まずは,RSI,MACDと組み合わせてトレンドの方向を判断する.次に,Stochasticsと組み合わせて,オーバーバイかオーバーセールかを判断し,部分信号をフィルターする.注文が入った後に,ATRを使用してリスクパラメータを計算し,自律停止を実現する.
具体的には,RSIが52を超え,MACD金叉が発生すると買入シグナルが生じ,RSIが48を下回り,MACDデッドフォークが発生すると売出シグナルが生じます.偽のシグナルをフィルタリングするために,ストカスティックスがオーバーバイ・オーバーセールであるかどうかを検出します. ストップに関しては,ATR計算パラメータに基づいて自律的なストップを実現し,単一ストップのリスクを効果的に制御します.
利点
この戦略の最大の利点は,リスク管理能力の強さにある.多因子モデルによってトレンドの方向性を判断し,一部のノイズをフィルターして信号の質を向上させることができる.同時に,自律的な止損機構は,市場の変動程度に応じて止損幅を調整し,単一の損失を効果的に制御することができる.
また,この戦略のパラメータ設定は合理的で,反測効果は優れている。異なる周期の資産はパラメータの調整によって最適化することができる。それはパラメータの最適化によってより多くの市場環境に適応することができる。
リスク
この戦略の主なリスクは,マルチファクターモデルの構築の質にある.モデルが正しく構築されていなければ,トレンドを効果的に判別できない場合,大量に誤った信号が生成される.さらに,止損戦略自体には,ブレイクされるリスクがある.
これらのリスクを軽減するために,モデル重み調整,パラメータ設定の最適化,その他の止損戦略の組み合わせなどの面で改善することができます.異常な市場が発生した場合には,手動介入も必要である.
最適化の方向
この戦略は以下の点で最適化できます.
-
多要素モデルにおける指標重量を調整して,最適の重量組み合わせを見つける
-
CCI,波動率など,より多くの指標をテストし,多要素モデルを豊かにする.
-
パラメータ設定を最適化して,より多くの品種と周期に対応
-
異なるストップ・ストラトジーを試し,最適の組み合わせを探します.
-
モデルトレーニングと戦略評価モジュールを追加し,機械学習駆動を実現
要約する
この戦略は,多要素モデルと自己適応のストップ・ローズ・メカニズムを統合し,トレンド判断とリスク管理の有機的な組み合わせを実現している.それは,反測効果が良好で,拡張性がある.継続的な最適化によって,長期にわたって保持する価値のある定量戦略になる可能性がある.
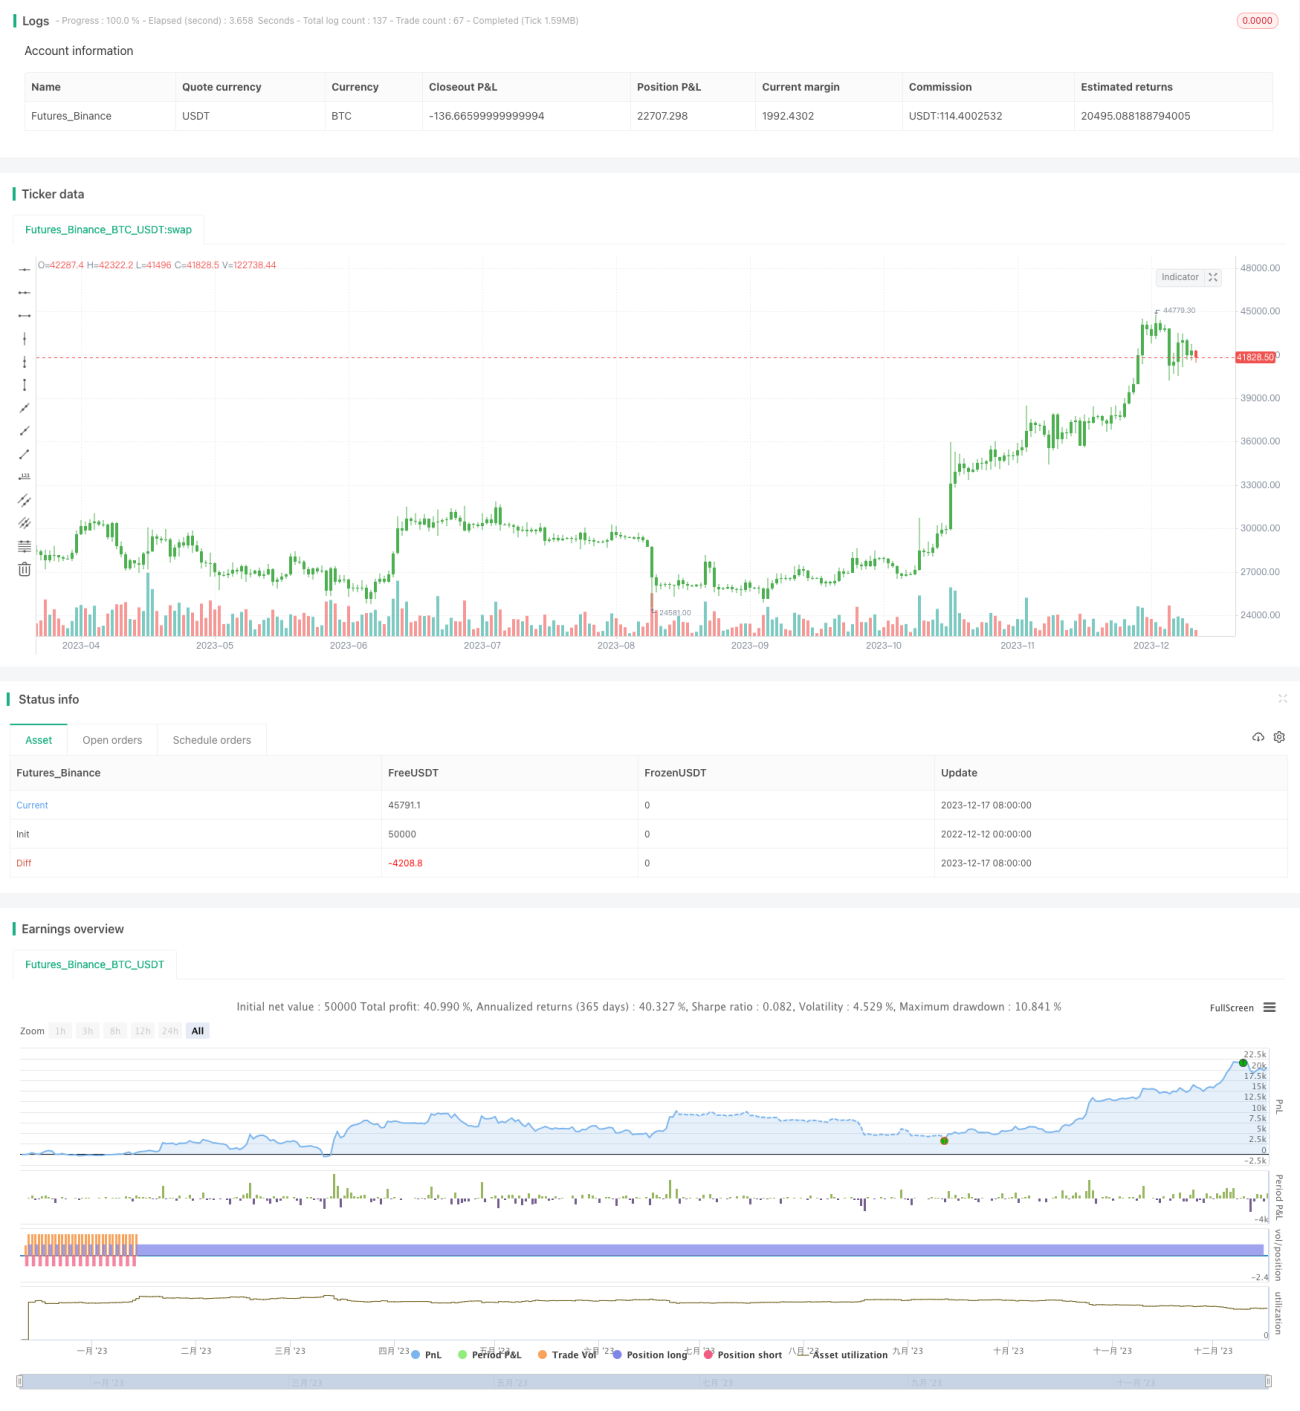
/*backtest
start: 2022-12-12 00:00:00
end: 2023-12-18 00:00:00
period: 1d
basePeriod: 1h
exchanges: [{"eid":"Futures_Binance","currency":"BTC_USDT"}]
*/

//@version=2
strategy(title="TradersAI_UTBot", overlay = true)
// CREDITS to @HPotter for the orginal code.
// CREDITS to @Yo_adriiiiaan for recently publishing the UT Bot study based on the original code - - 1