
概要
移動平均線逆引き戦略は,株価の移動平均線の交差を追跡し,金叉が発生した時に引き下げの機会があるかどうかを判断し,もしあるなら,逆操作を行う定量取引戦略である.この戦略は,フィボナッチ逆引きを活用して,入場点とストップ・ストップ・ストップを設定し,短期価格の引き下げを捕捉する.
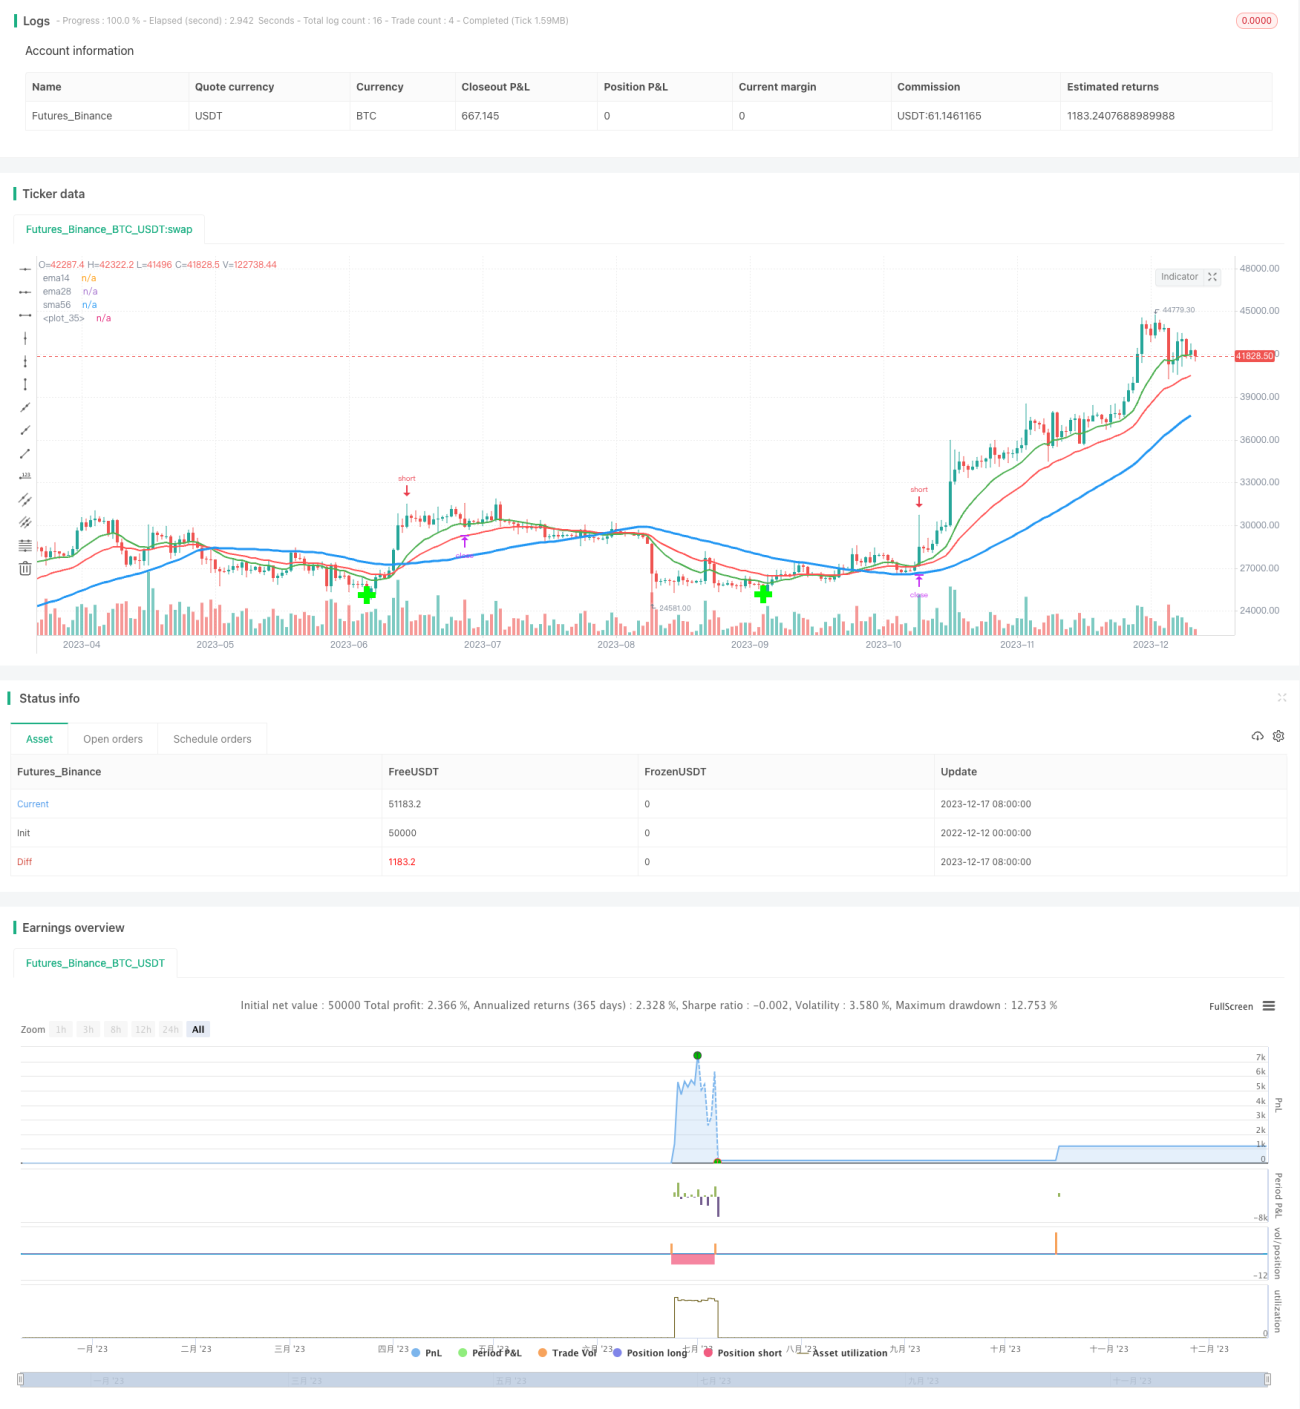
戦略原則
この戦略は,主に2つの移動平均である14日EMAと56日SMAに基づいています. 14日EMAが56日SMAを下から通過すると,買入シグナルが生じます. その後,コードは20日後に低値をサポートとして見つけ,通過点のクローズ価格と組み合わせてフィボナッチ回帰線を描画し,1.272倍回帰線をエントリーとして,0.618倍回帰線をエクジットとして描きます.
戦略は以下のステップで構成されています.
- 平均気温の上昇は,
- EMAでSMAを通過する金叉信号の発生を判断する.
- 支援の底をつかむこと
- 低点と金叉点の位置を利用してフィボナッチ回転線を描画する.
- 1.272回引線で空席入場点を設定する.
- 0.618回引線で止まる点を設定する.
これは,戦略の主要なプロセスであり,その原理である. 短期的な反転が起こると,この戦略は,そのような機会を捕捉して利益を得る.
戦略的優位性
移動平均の逆引き策には以下の利点があります.
- 戦略は明確でシンプルで,理解し,実行しやすい.
- ファイボナッチ理論により,入場と停止点を設定し,リスクのコントロールが良くなる.
- 短期的な価格逆転の機会を捉え,よりよい単一利益を得ることができます.
- 移動平均金叉の信号だけで起動でき,条件は厳しいものではありません.
全体として,この戦略は短線反転取引に適しており,市場状況が一定に逆転したときにこのような機会を捉えることができる.戦略の実施も比較的簡単で直接である.
戦略リスク
移動平均を引く戦略には利点がありますが,注意すべきリスクもあります.
- 長期にわたって持っていれば大きな損失を招く可能性があります. 逆勢の空白なので,物価が上昇し続ければ,大きな損失を招く可能性があります.
- 値引き幅が小さすぎれば利益を得られない.値引き幅が小さすぎれば,止境線に触れない,利益を得られない.
- 過剰設定リスクが発生する可能性がある. 引き戻し線があまりにも高く設定されていて,ブレーキの形成の機会に触れない. 合理的な引き戻し区間を計算する必要がある.
上記のリスクに対して,我々は,より短いストップ・タイムを設定し,単一の損失を厳格に制御し,引き戻しラインの区間範囲を最適化し,合理的な目標利益を設定して,部分的なリスクを回避することができる.
最適化の方向
この移動平均の逆引方策には多くの改善の余地があり,以下のような部分から改善が可能です.
-
移動平均の周期長さ,回帰日数,回帰線倍数など,異なるパラメータ設定をテストして,最適なパラメータを見つける.
-
リスク管理の改善のため,多重または移動的な停止を適用できる損失抑制機構の増強
-
他の指標Filterと組み合わせると,不適切な市場環境で取引を避ける.
-
資金管理の最適化,合理的なポジションサイズとリスクの設定
この戦略は,パラメータをテストして最適化することで,さらに改善され,より安定した取引パフォーマンスを得ることができます.
要約する
移動平均線回引戦略は,非常に実用的なショートライン取引戦略である.それは,価格が短期間に出現する逆転の機会を捉え,事前に設定されたエントリーポイントとストップポイントを通じて取引することができる.戦略のアイデアは明確でシンプルで,容易に理解し,実行することができる.同時に,パラメータ最適化,リスク管理などの手段によってさらに完善する必要がある一定の取引リスクもある.全体的に,これは深入な研究と応用に値する量化戦略である.
- 1