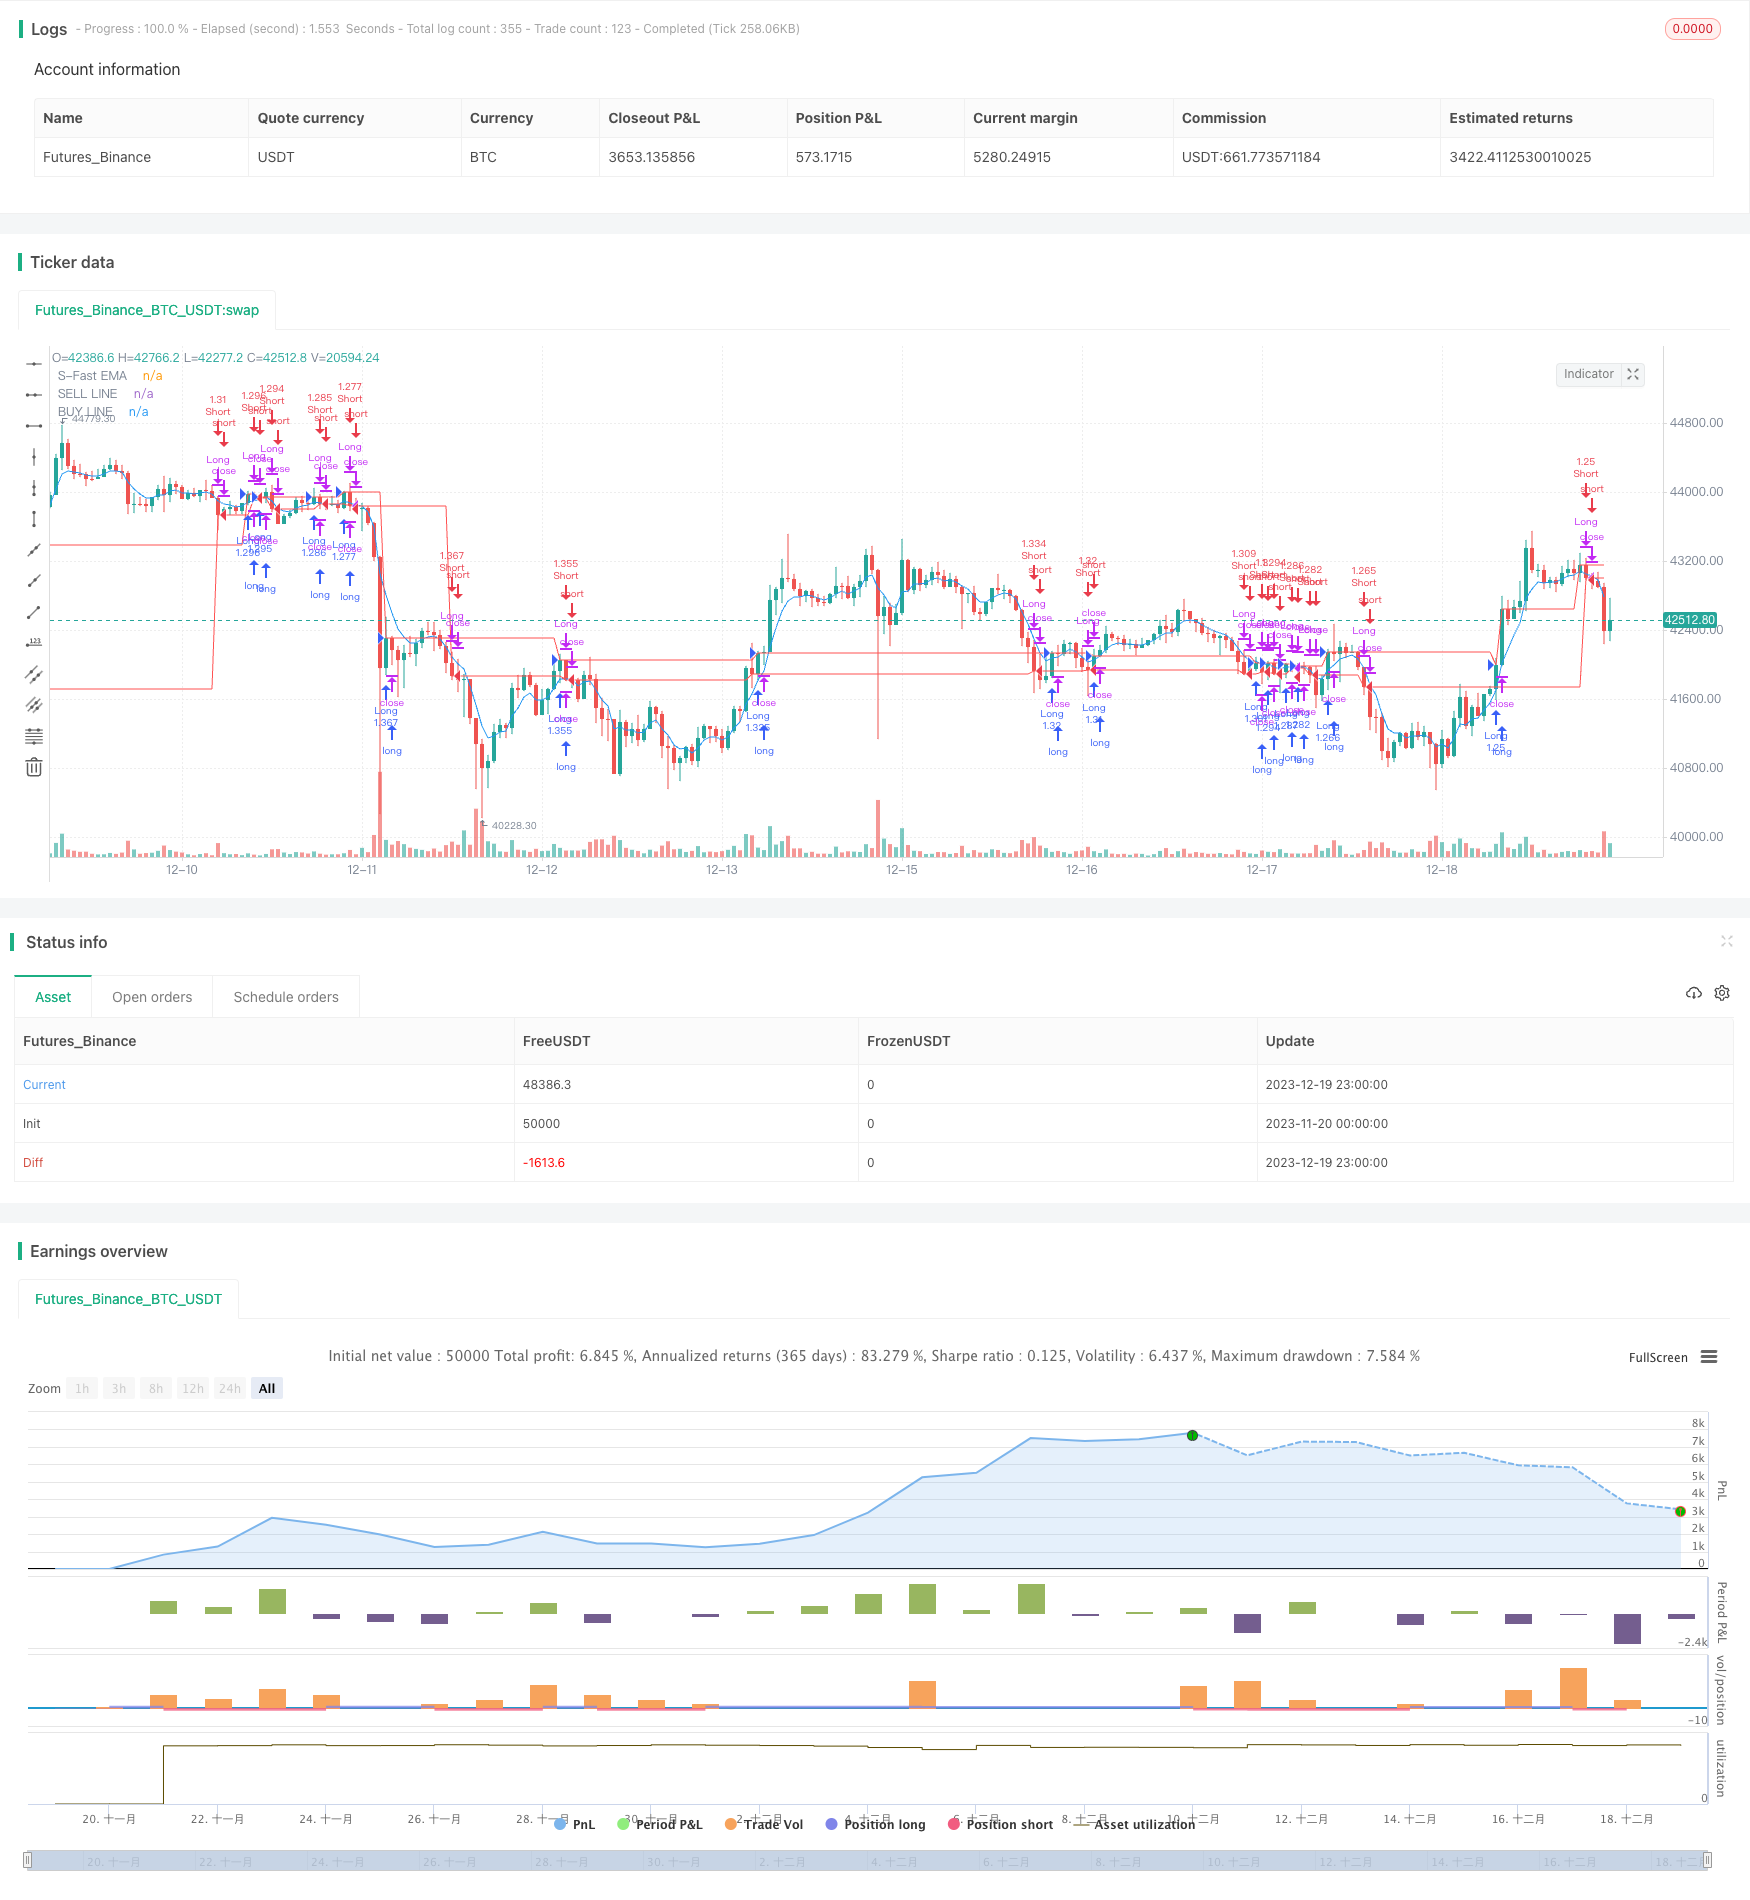
スリードラゴンズ複合テクニカル取引戦略

概要
三龍システム (三龍システム) は,延長価格量トレンド指標,唐通道指標,パラパラ線SAR指標を組み合わせた複合技術取引戦略である.この戦略は,3つの指標の互補的な優位性を利用して,市場トレンドの方向と潜在的買入シグナルを識別する.
戦略原則
この戦略は,まず,延長価格量トレンド指数と唐通路を使って市場の傾向の方向を判断する.延長価格量トレンド指数がベースライン上にあり,価格が唐通路上軌道上にあるときは,上昇傾向にあることを示し,逆に,延長価格量トレンド指数がベースライン下にあり,価格が唐通路下軌道上にあるときは,下降傾向にあることを示している.
市場トレンドの方向を特定した後,この戦略は,特定の買いと販売のタイミングを特定するためにパラボララインSAR指針を導入します.パラボララインSAR指針の下の価格を穿越すると,買い信号を生じます.パラボララインSAR指針上の価格を穿越すると,売り信号を生じます.
信号をさらに検証するために,この戦略は,複数の時間周期でトレンドの方向を確認し,市場が激しく波動するときに入場を避ける.さらに,この戦略は,利益をロックし,リスクを制御するために複数の停止レベルを設定しています.
優位分析
三龍システムの最大の利点は,指標の組み合わせが相互補完的な3つの異なるタイプの指標を使用することで,市場動向をより全面的に正確に判断できるということです.具体的には,主な利点は以下の通りです.
- 延長価格量トレンド指標は,トレンドの変化点とトレンドの強さを正確に識別できる.基本的には良好である.
- 唐通路の指標は,トレンドの方向を明確に判断し,トレンドを把握するのに役立ちます.
- パラロイドSARは,トレンド指数と組み合わせて,より正確に買い物や売り場の位置を特定することができます.
指標の有機結合により,各指標の優位性を充分に発揮することができ,三龍システムは,大中長線走勢を正確に判断し,買賣点をより精密に識別し,より優れたリスク/利益比率を得ることができます.
リスク分析
三龍システムは,指数组合戦略として,全体的なリスクは制御可能ですが,注意すべきあるリスクがあります:
- 価格量トレンド指標の拡張は,偽突破や巨額の反転の際に誤判するリスクを判断します.
- 震災の整理過程で,唐津通路は狭くなり,誤信号が生じる可能性が高い.
- パラパラ SAR パラメータの設定不適切であることも,買賣点の識別に一定の影響を及ぼします.
上記のリスクに対して,指標のパラメータ設定を適切に調整し,他の指標の判断を参考にすることで,単一の指標の失敗の確率を減らすことをお勧めします. さらに,合理的なストップとポジション管理は,戦略の全体的なリスク管理に不可欠です.
戦略の最適化
三龍システムにはさらに最適化できる余地があります.
- 機械学習アルゴリズムの自動最適化指標パラメータを導入できます.
- 戦略の安定性を高めるために,変動率指標の補助判断を導入することを検討できる.
- 感情の指標を組み合わせて, 国民の感情の波動が戦略に与える影響を判断できます.
アルゴリズム化パラメータ最適化,多指標組み合わせ判断,行動量化分析により,三龍システムの収益率と安定性をさらに向上させる見込みである.我々は,業界最先端の技術に継続的に注目し,改善戦略システムを継続的に最適化する.
要約する
三龍システムは,価格量トレンド指標,唐津通路指標,パラパラ線SAR指標の3人の優位性を互補して市場動向を判断し,買賣点を見つけ出す技術指標の組み合わせ戦略である.この戦略は,精密な判断,リスクが制御可能で,繰り返し検証され,中長期の投資家に適した有効な戦略システムである.我々は,より優良なリスク・報酬比率を期して,三龍システムを継続的に最適化する.
/*backtest
start: 2023-11-20 00:00:00
end: 2023-12-20 00:00:00
period: 1h
basePeriod: 15m
exchanges: [{"eid":"Futures_Binance","currency":"BTC_USDT"}]
*/

//@version=5
strategy(title="TRIPLE DRAGON SYSTEM", overlay=true,default_qty_type = strategy.percent_of_equity,default_qty_value=100,initial_capital=1000,pyramiding=0,commission_value=0.01)
/////////////// DRAG-ON ///// EMA'S ///////////////
emar = ta.ema(close,5)
plot(emar, color=color.blue, title="S-Fast EMA")
//EMAlengthTRF = input.int(200, minval=1,title = "EMA Filter")
//ematrf = ta.ema(close,EMAlengthTRF)
//plot(ematrf, "EMA-TREND FILTER", color=color.red,linewidth = 4)
/////////////// 1-DRAG-ON /////EXTENDED PRICE VOLUME TREND ///////////////
lenght = input(200,"EPVT - Trend Lenght")
var cumVol = 0.
cumVol += nz(volume)
if barstate.islast and cumVol == 0
    runtime.error("No volume is provided by the data vendor.")
src = close

vt = ta.cum(ta.change(src)/src[1]*volume)
upx = ta.highest(vt,lenght)
downx = ta.lowest(vt,lenght)
basex = (upx +downx)/2
VTX = vt - basex

/////////////// 2-DRAG-ON ///// DON TREND ///////////////

length = input.int(200, minval=1, title = "Donchian Lenght")
lower = ta.lowest(length)
upper = ta.highest(length)
basis = math.avg(upper, lower)

updiff = upper - close
downdiff = lower - close
dontrend = -(updiff + downdiff)

xupx = ta.highest(dontrend,length) >0 ? ta.highest(dontrend,length) : 0

xdownx = ta.lowest(dontrend,length) < 0 ?ta.lowest(dontrend,length) :0
xxbasisxx = math.avg(xdownx, xupx)

inversedragup = xupx[1]
inversedragdown = xdownx[1]
inversedragon = (inversedragup+inversedragdown)/2

/////////////// 3-DRAG-ON ///// SUPER SAR-X ///////////////
start = input(0.02)
increment = input(0.02)
maximum = input(0.8)
entry_bars = input(1, title='Entry on Nth trend bar')

atr = ta.atr(14)

atr := na(atr) ? ta.tr : atr

psar = 0.0  // PSAR
af = 0.0  // Acceleration Factor
trend_dir = 0  // Current direction of PSAR
ep = 0.0  // Extreme point
trend_bars = 0

sar_long_to_short = trend_dir[1] == 1 and close <= psar[1]  // PSAR switches from long to short
sar_short_to_long = trend_dir[1] == -1 and close >= psar[1]  // PSAR switches from short to long

trend_change = barstate.isfirst[1] or sar_long_to_short or sar_short_to_long

// Calculate trend direction
trend_dir := barstate.isfirst[1] and close[1] > open[1] ? 1 : barstate.isfirst[1] and close[1] <= open[1] ? -1 : sar_long_to_short ? -1 : sar_short_to_long ? 1 : nz(trend_dir[1])

trend_bars := sar_long_to_short ? -1 : sar_short_to_long ? 1 : trend_dir == 1 ? nz(trend_bars[1]) + 1 : trend_dir == -1 ? nz(trend_bars[1]) - 1 : nz(trend_bars[1])

// Calculate  Acceleration Factor
af := trend_change ? start : trend_dir == 1 and high > ep[1] or trend_dir == -1 and low < ep[1] ? math.min(maximum, af[1] + increment) : af[1]

// Calculate extreme point
ep := trend_change and trend_dir == 1 ? high : trend_change and trend_dir == -1 ? low : trend_dir == 1 ? math.max(ep[1], high) : math.min(ep[1], low)

// Calculate PSAR
psar := barstate.isfirst[1] and close[1] > open[1] ? low[1] : barstate.isfirst[1] and close[1] <= open[1] ? high[1] : trend_change ? ep[1] : trend_dir == 1 ? psar[1] + af * atr : psar[1] - af * atr

//////////////// MELODY ///////////////////
VTY = ta.valuewhen(ta.cross(VTX,0),close,0)
//plot(VTY, color=color.black, title="Extended-PVT")

//DONTRENDX = ta.valuewhen(ta.cross(dontrend,0),close,0)
//plot(DONTRENDX, color=color.red, title="DONCHIAN TREND")

SSARX = ta.valuewhen(ta.cross(psar,close),close,0)
//plot(SSARX, color=color.black, title="SSAR-X")

MAXDRAG = math.max(SSARX,VTY)
//plot(MAXDRAG, color=color.black, title="MAX DRAG")
MINDRAG = math.min(SSARX,VTY)
//plot(MINDRAG, color=color.black, title="MIN DRAG")
BASEDRAG = math.avg(MAXDRAG,MINDRAG)
//plot(BASEDRAG, color=color.red, title="BASE DRAG")


/////BUY AND SELL LOGIC ///////////
DRAGONBUY = (ta.crossover(close,MAXDRAG) or ta.crossover(close,MINDRAG) )
DRAGONBUYSTOP = (ta.crossunder(close,MAXDRAG) or ta.crossunder(close,MINDRAG))
DRAGONBUYPLOT = ta.valuewhen(DRAGONBUY==true,close,0)
plot(DRAGONBUYPLOT, color=color.red, title="BUY LINE")

DRAGONSELL = (ta.crossunder(close,MAXDRAG) or ta.crossunder(close,MINDRAG) )
DRAGONSELLSTOP = (ta.crossover(close,MAXDRAG) or ta.crossover(close,MINDRAG))
DRAGONSELLPLOT = ta.valuewhen(DRAGONSELL==true,close,0)
plot(DRAGONSELLPLOT, color=color.red, title="SELL LINE")

/////TAKE PROFIT LOGIC ///////////
tp1 = input.int(5, minval=1,title = "TP-1")
tp2 = input.int(10, minval=1,title = "TP-2")
tp3 = input.int(15, minval=1,title = "TP-3")

TPTAKA1B = DRAGONBUYPLOT*(1+tp1/100)
//plot(TPTAKA1B, "BUY-TP1", color=color.red,linewidth = 1)
TPTAKA2B = DRAGONBUYPLOT*(1+tp2/100)
//plot(TPTAKA2B, "BUY-TP2", color=color.red,linewidth = 1)
TPTAKA3B = DRAGONBUYPLOT*(1+tp3/100)
//plot(TPTAKA3B, "BUY-TP3", color=color.red,linewidth = 1)

TPTAKA1S = DRAGONSELLPLOT*(1-tp1/100)
//plot(TPTAKA1S, "SELL-TP1", color=color.red,linewidth = 1)
TPTAKA2S = DRAGONSELLPLOT*(1-tp2/100)
//plot(TPTAKA2S, "SELL-TP2", color=color.red,linewidth = 1)
TPTAKA3S = DRAGONSELLPLOT*(1-tp3/100)
//plot(TPTAKA3S, "SELL-TP3", color=color.red,linewidth = 1)


BUYTP = ta.crossunder(emar,TPTAKA1B) or ta.crossunder(emar,TPTAKA2B) or ta.crossunder(emar,TPTAKA3B)
SELLTP = ta.crossover(emar,TPTAKA1B) or ta.crossover(emar,TPTAKA2B) or ta.crossover(emar,TPTAKA3B)

/////STRATEGY ///////////
// Enter condition
longCondition = DRAGONBUY==true
if longCondition
    strategy.entry('Long', strategy.long, comment = "ENTER-LONG")

// Exit condition
strategy.close('Long', when=DRAGONBUYSTOP, comment = "EXIT-LONG")

// Enter condition
ShortCondition = DRAGONSELL
if ShortCondition
    strategy.entry('Short', strategy.short, comment = "ENTER-SHORT")

// Exit condition
strategy.close('Short', when=DRAGONSELLSTOP, comment = "EXIT-SHORT")
///// END OF STRATEGY ///////////